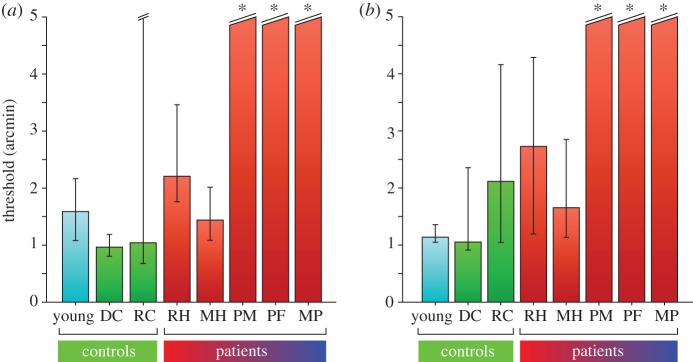
Figure 4.
Stereo thresholds for (a) dynamic stimuli and (b) fine disparity stimuli. Bars show the disparity at which performance reached 84% correct. Error bars show 95% CIs. Asterisk (*): thresholds for patients PM, PF and MP could not be estimated accurately since their performance was less than 84% correct at the largest disparities tested (±14 arcmin).

