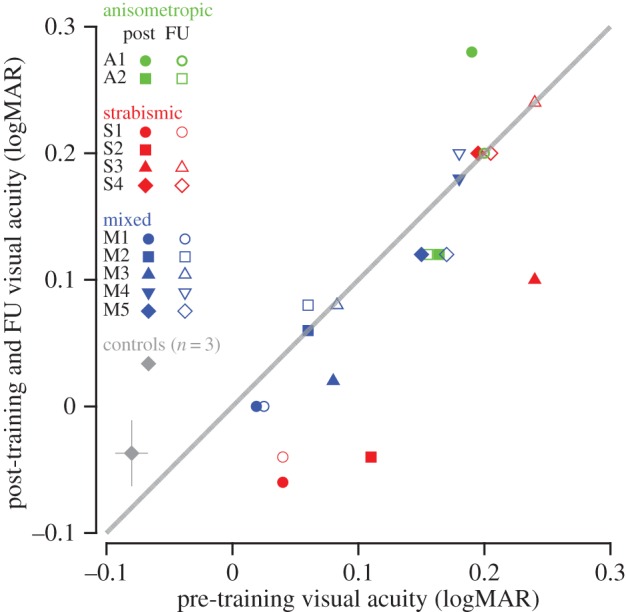
Figure 8.

Pre- versus post-training (solid symbols) and follow-up (open symbols) visual acuity (logMAR). Each coloured symbol shows the data of a single stereo-deficient observer. The grey diamond shows the mean pre/post-data of the three normal control observers who underwent training. Data under the diagonal unity line indicate increases in visual acuity. FU, follow up; logMAR, logarithm of the minimum angle of resolution.
