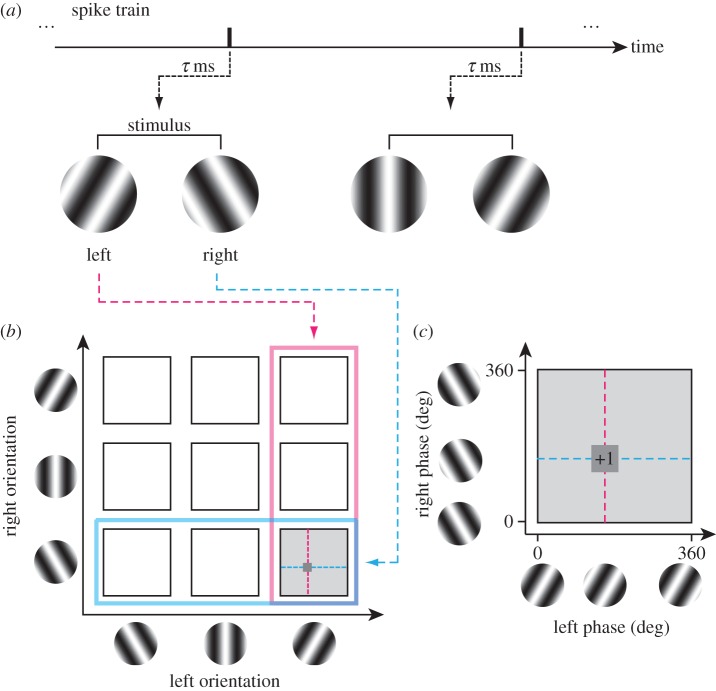
Figure 10.
Reverse correlation analysis was performed to obtain a binocular OR interaction map and a binocular interaction map. (a) Using spike data recorded while static sinewave grating stimuli were presented dichoptically in rapid flashes, a pair of spike-triggered stimuli was selected for an optimal correlation time delay. OR and phase parameters in the left and right eyes were extracted for the selected grating pair. (b) Spike-triggered average in a joint left–right OR domain. A spike was voted in a four-dimensional domain (ORL, ORR, phL, phR). The procedure may be understood in the following steps. First, a spike-triggered pair of ORs (ORL, ORR) was determined (left, pink; right, cyan). The selected pair is indicated by a grey square. (c) Then, within the selected joint phase subdomain (phL, phR), the spike was voted into a particular phase combination for the stimulus pair. By repeating this procedure for all recorded spikes, complete binocular phase selectivity maps were obtained for various OR pairs between the two eyes.

