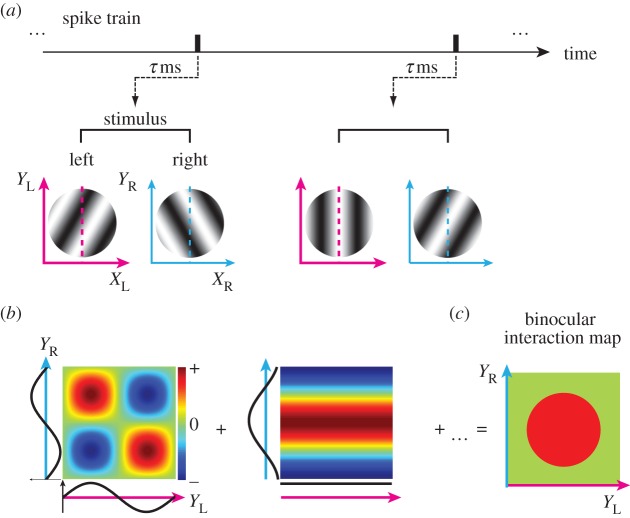
Figure 12.
Reverse correlation analysis in the joint left–right Y domain was performed using the identical spike train and set of stimuli to obtain a bRF for a given neuron. (a) Using a spike train recorded while binocular sinewave grating stimuli were presented, spike-triggered stimulus pairs were selected for an optimal correlation time delay. (b) Binocular interaction terms were calculated from each pair of spike-triggered gratings as follows. The YL- and YR-axes are defined as the axis parallel to preferred OR in the left and right eyes, respectively. The one-dimensional spike-triggered sinusoids that passed through the stimulus centres (broken pink and cyan lines in (a)) were multiplied to produce binocular interaction terms in the joint YL–YR domain. Positive values (red) mean that stimuli with the same contrast polarity were presented between the two eyes, whereas negative values (blue) mean those with the opposite polarity were presented between the two eyes. (c) A binocular interaction map was obtained by summing these interaction terms for all spike-triggered stimulus pairs. Binocular disparity along preferred OR is constant along the +45° diagonal in the map, whereas disparity changes along the −45° diagonal.

