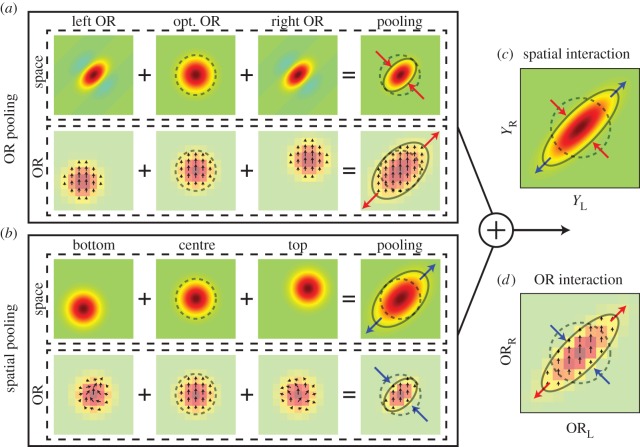
Figure 14.
Effects of simultaneous OR pooling and spatial pooling are predicted by a model. (a) OR pooling causes an elongation of a left–right OR interaction map (ORL–ORR) by extending its extent along the 45° axis (bottom; outward pair of red arrows). But it also reduces the extent of spatial (YL–YR) binocular interaction map along the −45° axis (top; inward pair of red arrows). Each column of left, opt. and right OR shows a binocular interaction map (top row) and its binocular OR interaction map (bottom row) for a binocular energy unit with left, optimal and right OR, respectively. Other parameters for each model are identical across subunits. Arrows in the OR interaction maps indicate the phase of IOPD tuning (figure 13, left). Since subunits are located at the same position, the phase is unchanged. (b) Conversely to (a), spatial pooling extends the spatial binocular interaction map (YL–YR) along the 45° axis (top; outward pair of blue arrows). But it also reduces the extent of left–right OR interaction map (ORL–ORR) by cancelling responses at upper left and lower right areas of the map along (bottom; inward pair of blue arrows). The model pools subunits densely at many spatial positions, but for clarity is shown with three subunits: bottom, centre and upper. Note that arrows indicate phases of tuning curves like those in figure 11d. Some arrows in the OR interaction maps show complex patterns of rotation. These phase variations are the basis of response cancellation. (c) When OR pooling and spatial pooling are present simultaneously, effects from both on the spatial binocular interaction map (YL–YR) add up, causing further elongation (outward blue arrows and inward red arrows). (d) Binocular OR map (ORL–ORR) is shown. This map is also extended further by the constructive addition of effects from simultaneous OR and space pooling (outward red arrows and inward blue arrows).

