
Fig. 2.
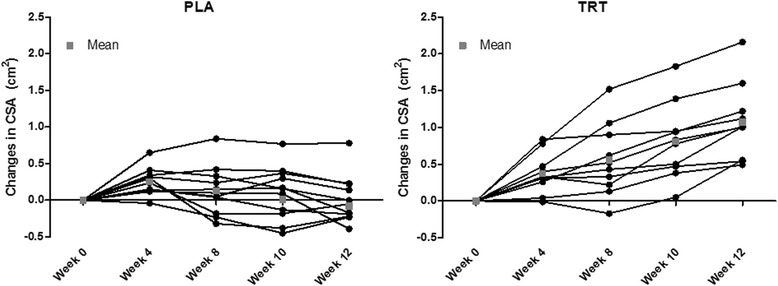
Individual Changes in CSA. Data presented represent the mean for each participant at all time points. The group mean is presented as a gray square at each time point
Official websites use .gov
A
.gov website belongs to an official
government organization in the United States.
Secure .gov websites use HTTPS
A lock (
) or https:// means you've safely
connected to the .gov website. Share sensitive
information only on official, secure websites.
Individual Changes in CSA. Data presented represent the mean for each participant at all time points. The group mean is presented as a gray square at each time point