
Fig. 6.
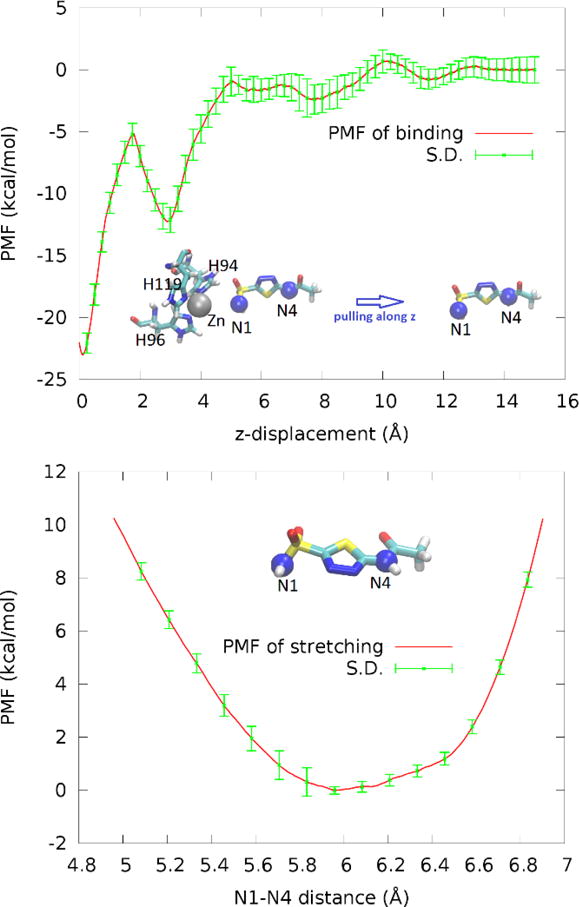
PMF along the dissociation path of pulling AZM from hCAII-Zn2+ (top panel) and PMF as a function of the distance between two pulling centers (N1 and N4) of AZM in the dissociated state (bottom panel). In the insets, the pulling centers are shown as spheres (N1, N4, blue; Zn2+, gray). AZM and the zinc coordinating residues are shown in licorices.