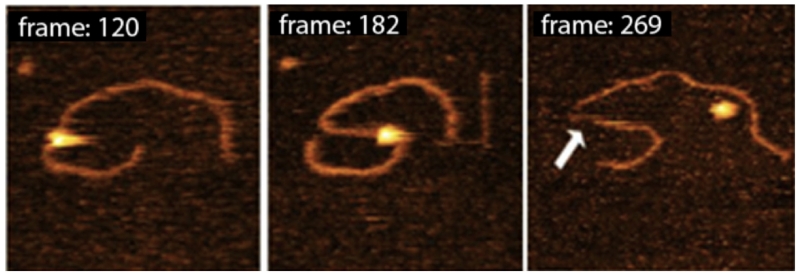
FIG. 20.
HS-AFM data with a few selected frames illustrating the dynamics of complexes of SSB with 69-gap-DNA, prepared in standard conditions. Each frame is 990 msec. The bar size is 50 nm. The arrow points to the exposed ssDNA region appearing after protein dissociation [reprinted with permission from the American Chemical Society, Copyright 2012].80

