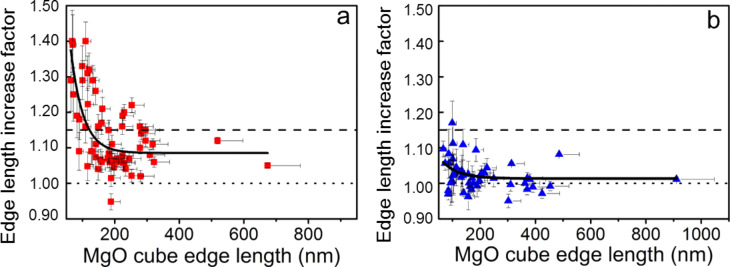
Figure 3.
Quantification of morphological changes: Curves showing the edge length increase factor of MgO cubes (L2/L1) as a function of the edge length L1, where L1 and L2 are the edge lengths before and after storage in the vacuum chamber of the HIM, respectively. (a) The indium foil was used without any further treatment. The dashed line corresponds to a full transformation of MgO into Mg(OH)2 (i.e., L2/L1 = 1.15). The dotted line corresponds to zero expansion (L2/L1 = 1). The y-error bars correspond to the uncertainty caused by the HIM measurement (pixel element size related to magnification and image resolution). The x-error bars correspond to the possible effect of the tilt (maximum 30° tilt, inducing a possible underestimation of the edge length of 15%). The continuous black lines (exponential fits) are shown as guides to the eye. (b) The indium foil was dried under vacuum before being used as a substrate.

