Figure 1.

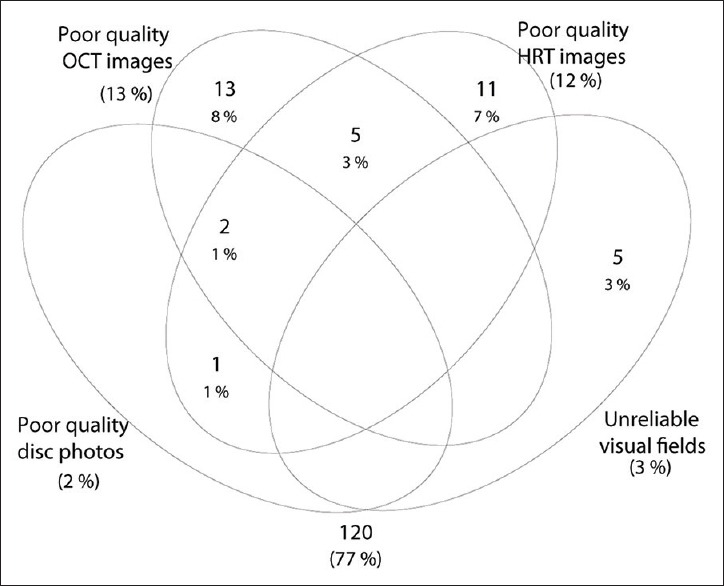
Venn diagram showing the number of eyes excluded from analysis because of poor quality disc photographs, unreliable visual fields, and poor quality high-definition optical coherence tomography and Heidelberg retina tomogram images

Venn diagram showing the number of eyes excluded from analysis because of poor quality disc photographs, unreliable visual fields, and poor quality high-definition optical coherence tomography and Heidelberg retina tomogram images