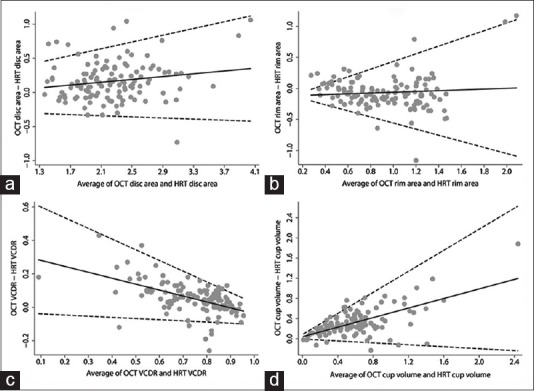
Figure 2.

Bland–Altman plots showing the agreement between high-definition optical coherence tomography and Heidelberg retina tomography for (a) disc area, (b) rim area, (c) vertical cup-disc ratio, and (d) cup volume parameters

Bland–Altman plots showing the agreement between high-definition optical coherence tomography and Heidelberg retina tomography for (a) disc area, (b) rim area, (c) vertical cup-disc ratio, and (d) cup volume parameters