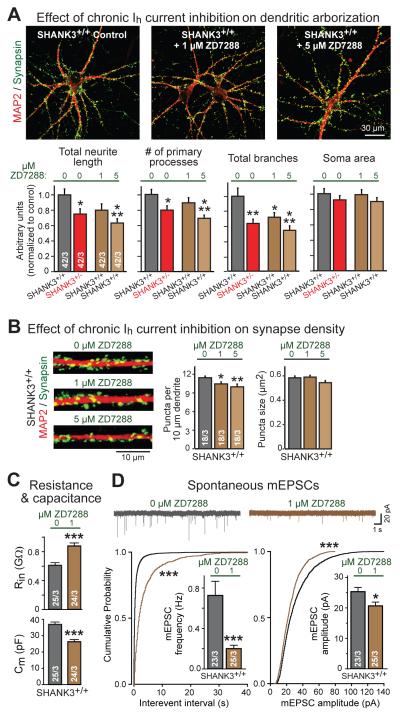
Figure 7. Chronic inhibition of Ih-currents in human neurons mimics SHANK3 haploinsufficiency phenotype.
A) Chronic partial inhibition of Ih-currents in wild-type SHANK3+/+ neurons causes dendritic arborization defects similar to SHANK3+/− haploinsufficiency. Matching SHANK3+/+ and SHANK3+/− neurons were differentiated from SHANK3+/cKO ES cells; SHANK3+/+ neurons were treated with low-dose ZD7288 (1 μM or 5 μM) from day 3-21 of neural induction (top, representative images of neurons double-labeled for MAP2 and synapsin; bottom, summary graphs of indicated parameters normalized to the untreated SHANK3+/+ control).
B) Chronic inhibition of Ih-currents in SHANK3+/+ neurons decreases synapse numbers. Experiments were performed as described for panel A (left, representative images of dendritic segments double labeled for MAP2 and synapsin; right, summary graphs of density and size of synaptic puncta).
C) Chronic inhibition of Ih-currents in SHANK3+/+ neurons significantly increases input resistance (Rin, top) and decreases cell capacitance (Cm, bottom). Experiments were performed as described for panel A; recordings were performed after washout of ZD7288.
D) Chronic inhibition of Ih-currents in SHANK3+/+ neurons with ZD7288 (1 μM) reduces the frequency and amplitude of spontaneous mEPSCs (top, representative traces; bottom left, summary plots of the interevent interval and summary graph of the mEPSC frequency; bottom right, same for the mEPSC amplitude). Experiments were performed as described for panel A; recordings were performed after washout of ZD7288.
Data are means ± SEM. Numbers of cells/cultures analyzed are shown in the bars. Statistical significance was evaluated by Student’s t-test (bar graphs in C and D), one-way ANOVA followed by Tukey’s post hoc test (bar graphs in B), or two-way ANOVA followed by Bonferroni’s post hoc test (bar graphs in A) or Kolmogorov-Smirnov-test (cumulative probability plots in D), (*, p<0.05; **, p<0.01; ***, p<0.001).

