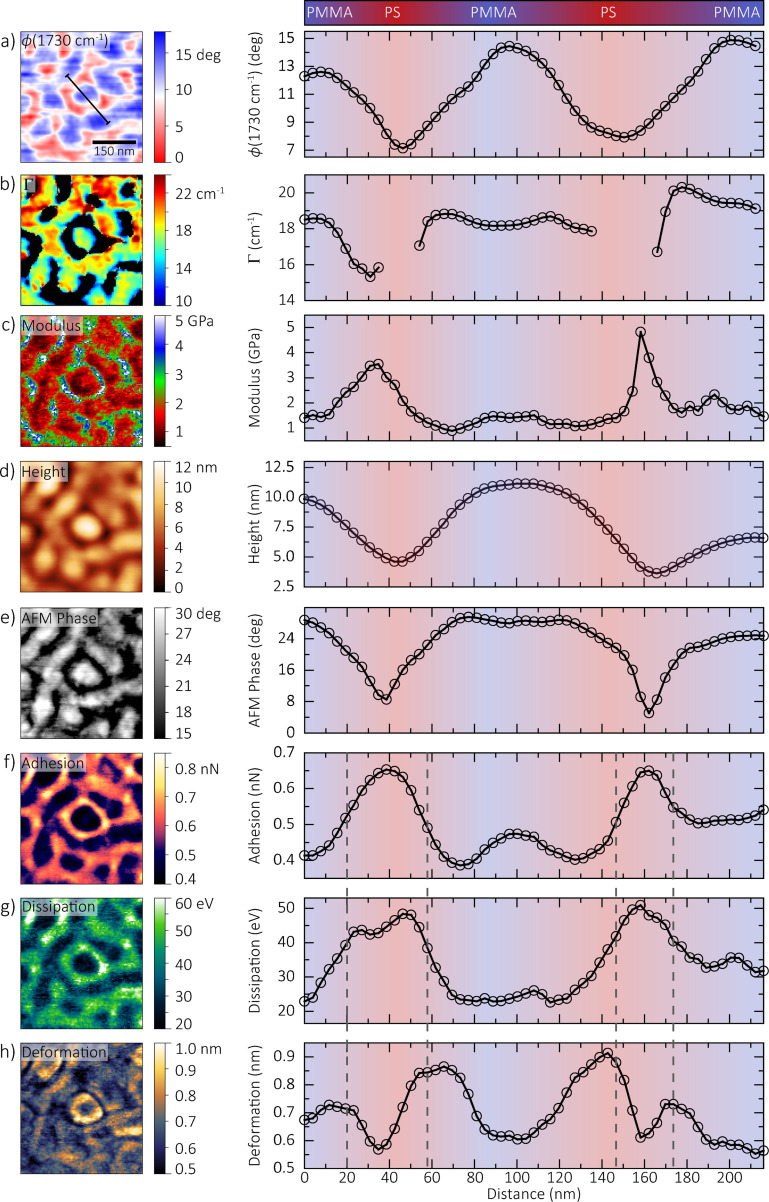
Figure 3.
Multidimensional dataset showing maps of PS and PMMA microdomains, with corresponding profiles along the line indicated in (a) averaged over a 5-pixel width. Color bar and profile background suggest regions of high PS or PMMA concentration. (a,b,d,e) measured using spatio-spectral s-SNOM and (c,f–h) measured using force–distance spectroscopy. Differences between channels, as highlighted by the dashed lines in (f–h), indicate a complex interplay between crystallinity, composition, and intermolecular interaction between and within single domains.

