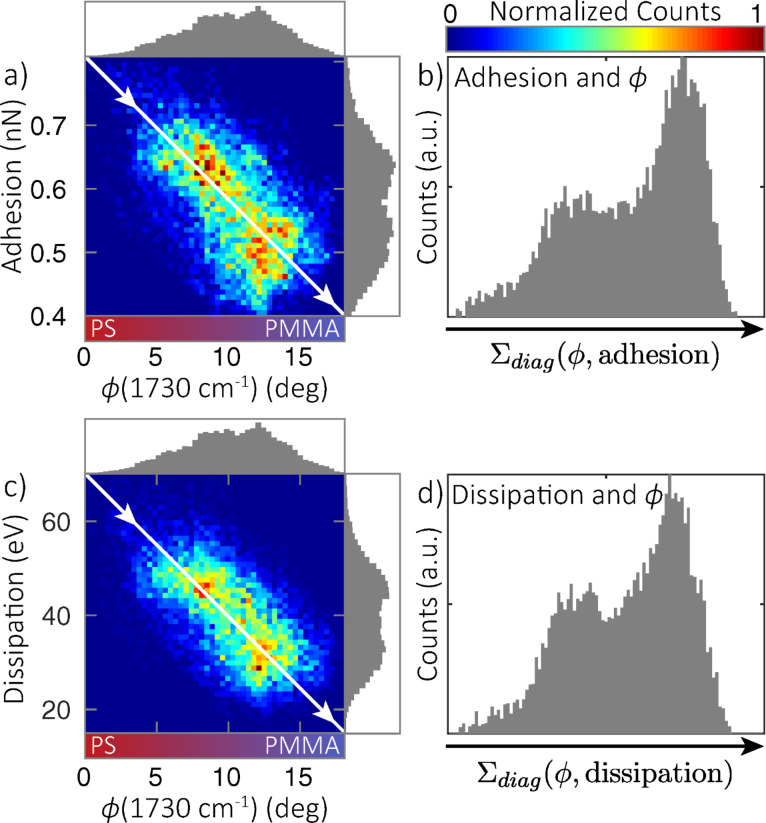
Figure 5.
Bivariate and corresponding coincidence histograms showing correlations between adhesion and  (1730 cm−1) (a,b), and dissipation and
  (1730 cm−1) (c,d). Histograms of each single channel are shown along the corresponding axis in (a) and (c). Coincidence histograms (b,d) calculated by summing counts in the bivariate histograms (a,c) along diagonal lines perpendicular to the direction of correlation (solid line). A bimodal distribution is apparent, indicative of separate populations of distinct chemistry and nanomechanical properties.

