
FIGURE 3.
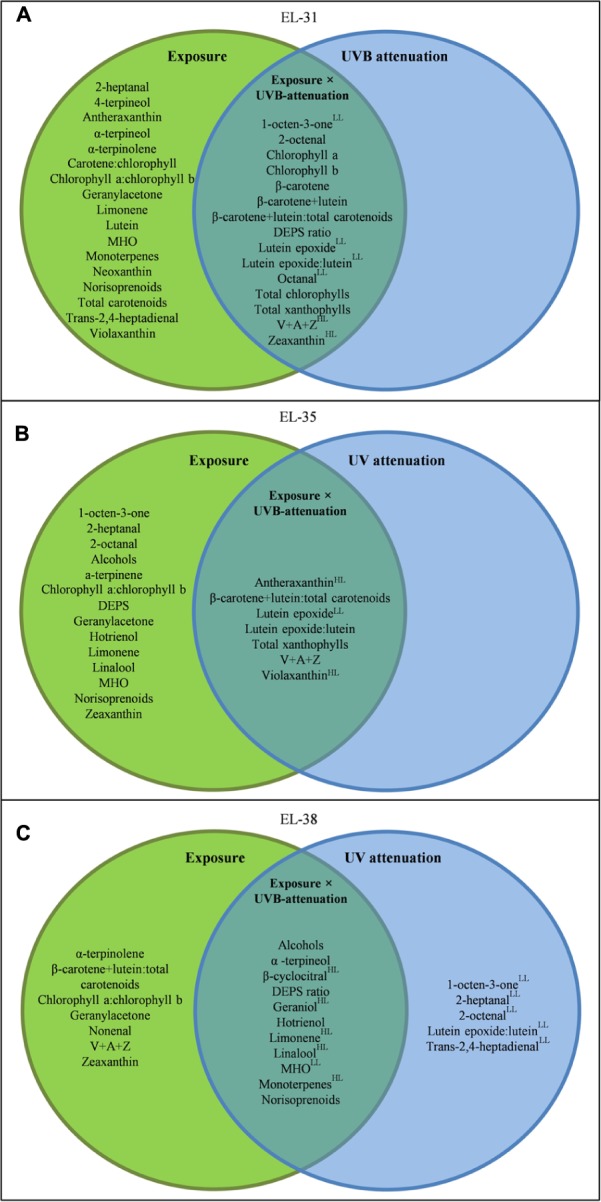
A Venn diagram showing the compounds which responded to light exposure (green circle), UVB attenuation (blue circle) and both (intercept) in the early (A), véraison (B), and late (C) developmental stages. Compounds were selected based on significance in a repeated measures ANOVA and Fisher LSD Post Hoc tests (adjusted p-value, q-value ≤0.05). All metabolites presented have a q-value ≤0.05. Metabolites with a log2-fold-change of ≥0.5 are indicated by a “HL” for the high light- or “LL” for the low light microclimate.