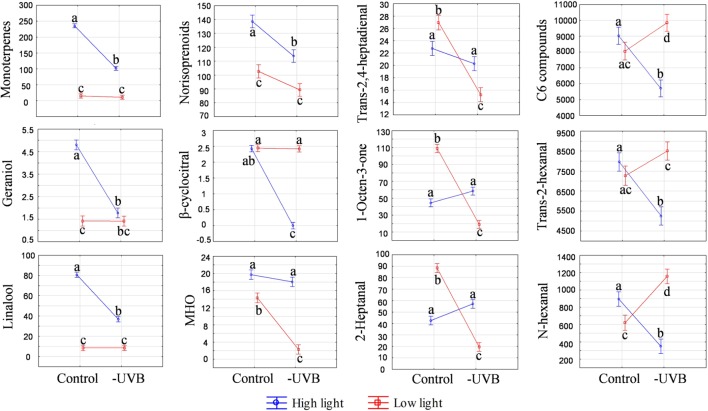
FIGURE 5.
Analysis of variance (ANOVA) plots for selected volatile compounds, including monoterpenes, norisoprenoids and C6 compounds measured at the late developmental stage (EL-38). The results for both high light and low light environments are represented. Different letters indicate significant difference (p ≤ 0.05).

