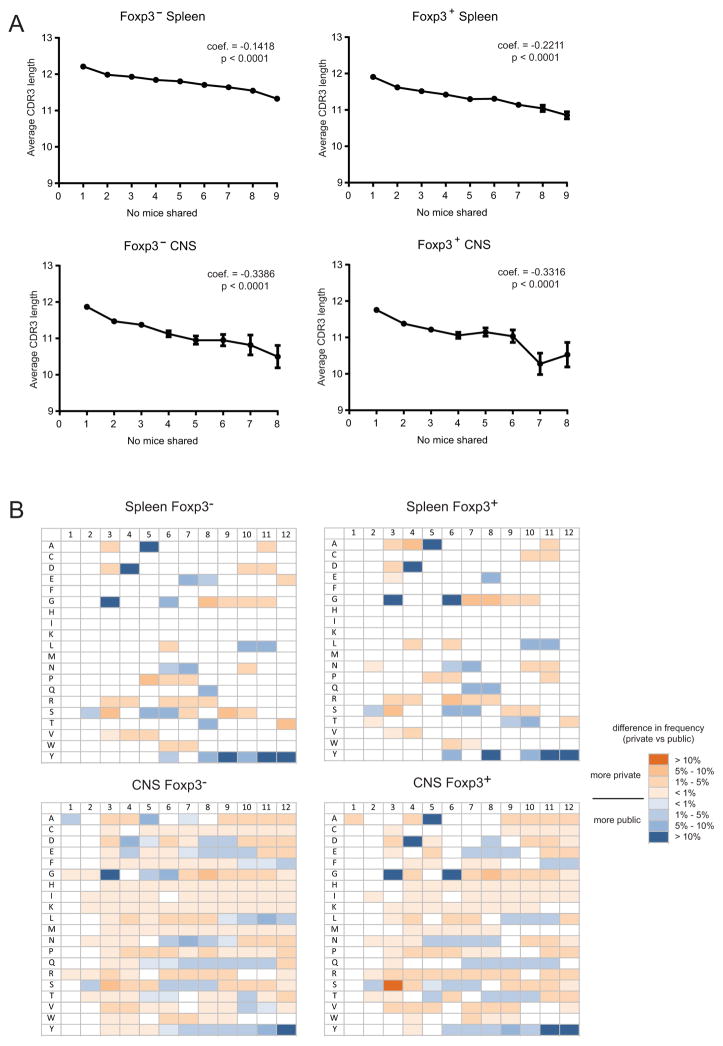
Figure 4. Changes in CDR3β length and amino acid composition with TCR publicity.
(A) Weighted linear regression analysis was applied to compare the CDR3β length with regard to TCR publicity in Foxp3− and Foxp3+ spleen and CNS samples. The p value and estimated regression coefficient for each sample is shown. (B) Sequences were segregated into private, moderately public (occurring in 2–4 mice), and highly public (occurring in 5–9 mice). The frequency of each amino acid at CDR3β positions 1–12 was calculated as a percentage of the total number of sequences in each set. Chi-squared analysis modified for multiple comparisons was used to determine if there were significant differences between private and each set of public sequences at each position for each amino acid. The heat map indicates positions at which statistical analyses indicated that specific amino acids were more common in highly public or private TCR. Similar trends were observed when comparing moderately public and private TCR (not shown). Coloration in the heat map indicates the magnitude difference observed between private and highly public sequences. Boxes without color did not have significant differences in amino acid frequency among the three populations.

