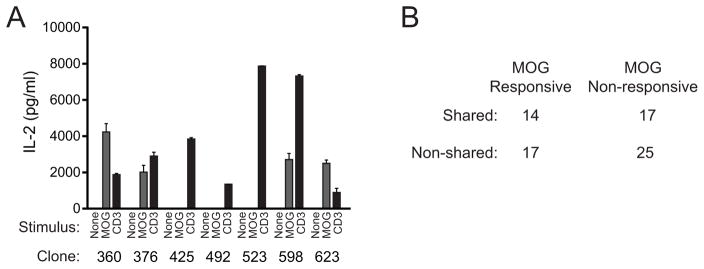
Figure 5. MOG-specificity of public and private CNS-infiltrating T cells.
T cell hybridomas were generated and cloned from CNS-infiltrating T cells from 50 mice with EAE. cDNA was generated from hybridomas staining positively with the KJ-16 (TRBV13-2, 3-specific) antibody. Full TCRβ sequence was obtained on 86 hybridomas (73 TRBV13-2+, 13 TRBV13-3+). The hybridomas were further assessed for MOG35–55 reactivity by culture in the absence of stimulation, with 100 μg/ml MOG35–55 and APCs, or with anti-CD3, and assaying IL-2 production. Sample IL-2 production from a single representative analysis showing identification of four MOG-reactive clones (360, 376, 598, 623) and three non-reactive TRBV13-2+ clones (425, 492, 523) is shown (A). (B) The table shows the numbers of isolated TRBV13-2+ hybridomas that were MOG35–55 reactive or non-reactive and whose TCRβ sequences were identified in the CNS of the 12 mice with early or late EAE analyzed by high throughput sequencing (Supplemental Table SI). Differences in the proportion of shared and non-shared TCR functionally responding to MOG35–55 were not identified (p>0.05, Fisher’s Exact Test).

