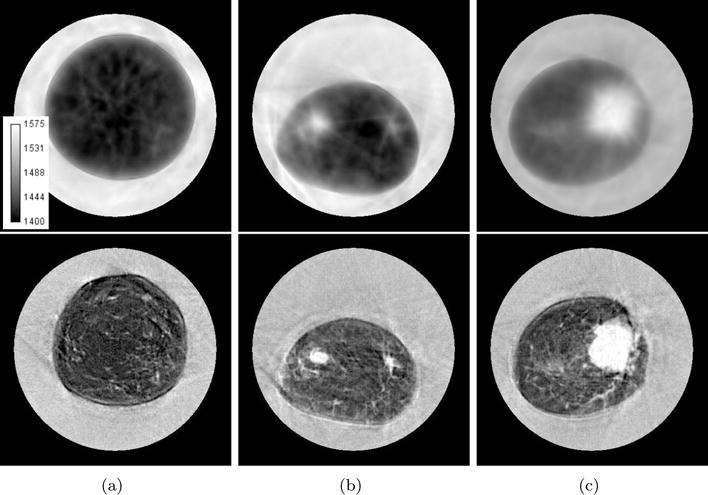
Figure 7.

Comparison of travel time (top row) and waveform (bottom row) reconstruction methods using newer ultrasound tomography unit. Gray scale values in the sound speed images correspond to a range of 1400–1575 m/s. Brighter areas correspond to higher sound speed. (a) Very fine parenchyma patterns. (b) 1 cm tumor (10 o’clock). (c) 4 cm tumor (3 o’clock).
