
Figure 18.
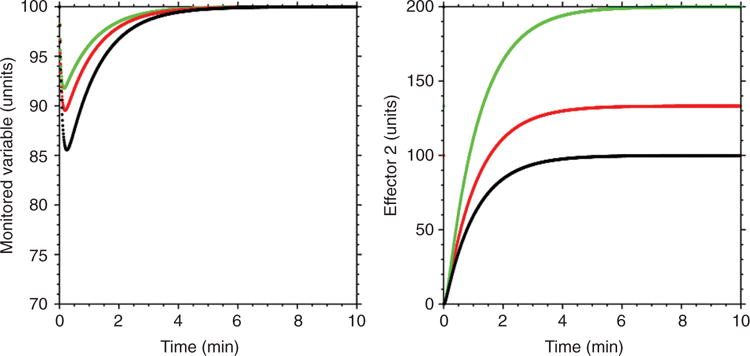
Computer-generated curves predicting effects of disabling one effector on activity of an alternative effector. As the rate constant for Effector 1 declines (green to red to black curves), the extent of activation of Effector 2 increases (compensatory activation).