
Figure 8.
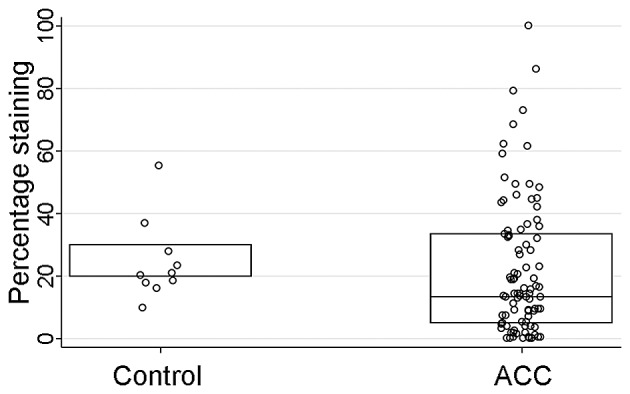
The comparisons of percentage of the positively stained cells between control and ACC cases. The percentage of the positively stained cells (P=0.1) was not statistically significant between control and ACC cases.
Official websites use .gov
A
.gov website belongs to an official
government organization in the United States.
Secure .gov websites use HTTPS
A lock (
) or https:// means you've safely
connected to the .gov website. Share sensitive
information only on official, secure websites.
The comparisons of percentage of the positively stained cells between control and ACC cases. The percentage of the positively stained cells (P=0.1) was not statistically significant between control and ACC cases.