Figure 2.
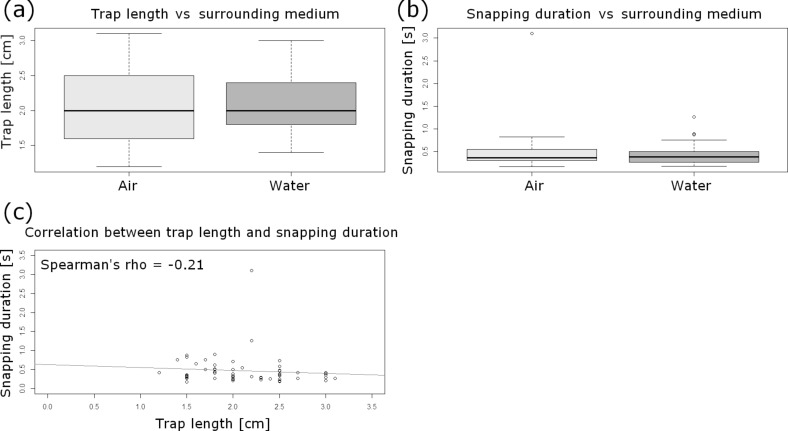
Statistical analyses of the comparative air/water snapping experiment. (a) Boxplot comparison of trap lengths in air and under water. The sample sizes for each surrounding medium is n = 30. The trap lengths are not significantly different between the different surrounding media (Wilcoxon rank sum test, W = 487.5; p > 0.05). (b) Boxplot comparison of snapping durations in air and under water. The sample sizes for each surrounding medium is n = 30. The snapping durations are not significantly different between the different surrounding media (Wilcoxon rank sum test, W = 472; p > 0.05). (c) Snapping durations do not correlate significantly with the trap lengths (Spearman‘s rho = −0.21). The regression line is indicated.

