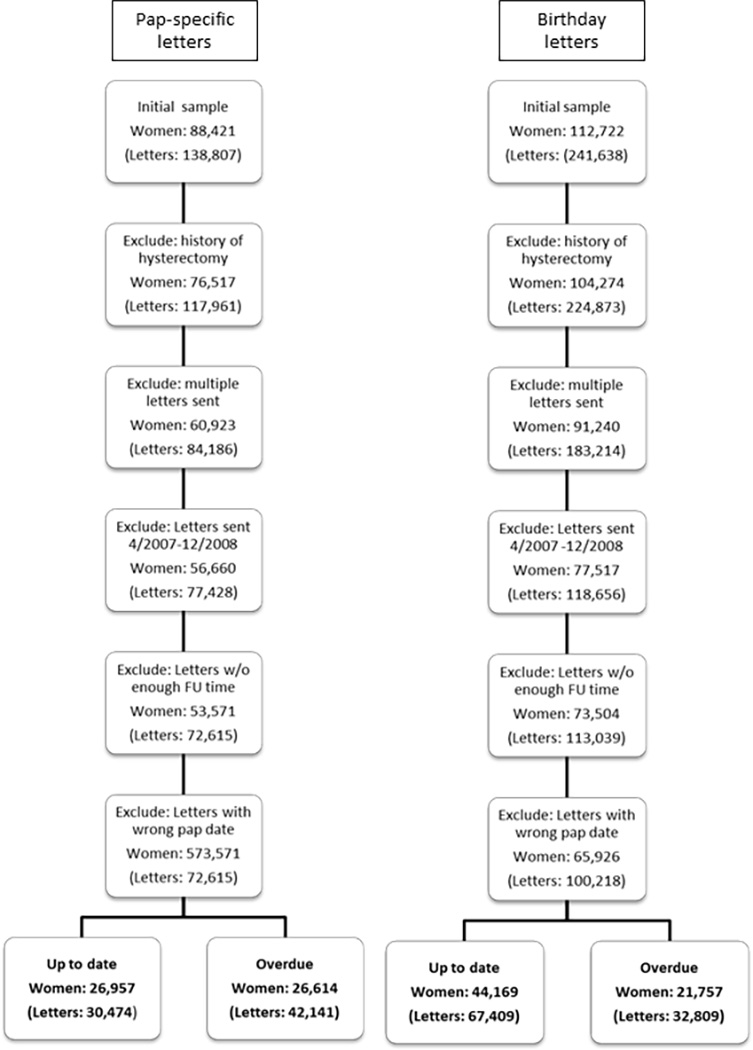
Figure 1. CONSORT diagram of women (and letters) included in the study after each exclusion criterion was applied.

Figure 1 is a CONSORT-like diagram showing the number of women (and letters in parenthesis) in the initial sample and remaining after each exclusion criterion was applied. At the bottom of the figure are the final sample sizes of women (and letters) included by letter type and whether women were up-to-date or overdue for screening.
