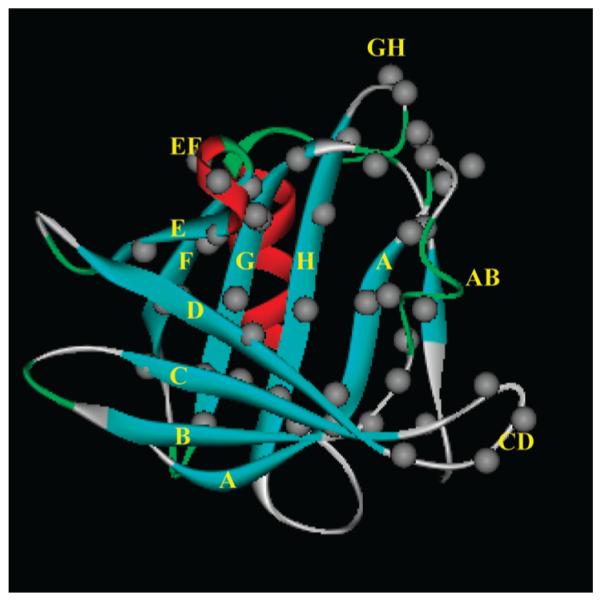
FIGURE 1.

Positions of the residues that were sequentially substituted with Trp to explore the binding energy landscape of TL. Gray circles show locations of the Cαatoms of the amino acid residues. The side chains of all β-strand residues are oriented inside the cavity. Single and double letters denote the identities of the β-strands and loops, respectively. The ribbon diagram (blue, β-strands; red, R-helix; green, turns; gray, loops) of TL was generated from PDB 1XKI.
