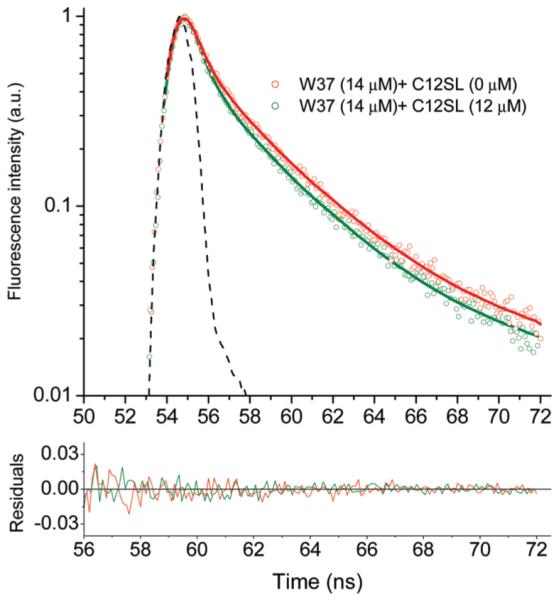
FIGURE 3.

Fluorescence intensity decay curves for W37 with various concentrations of C12SL. Dots represent experimental data points. Dashed line is IRF. Solid curves are generated by fitting the data to multiexponential decay (see Materials and Methods).
