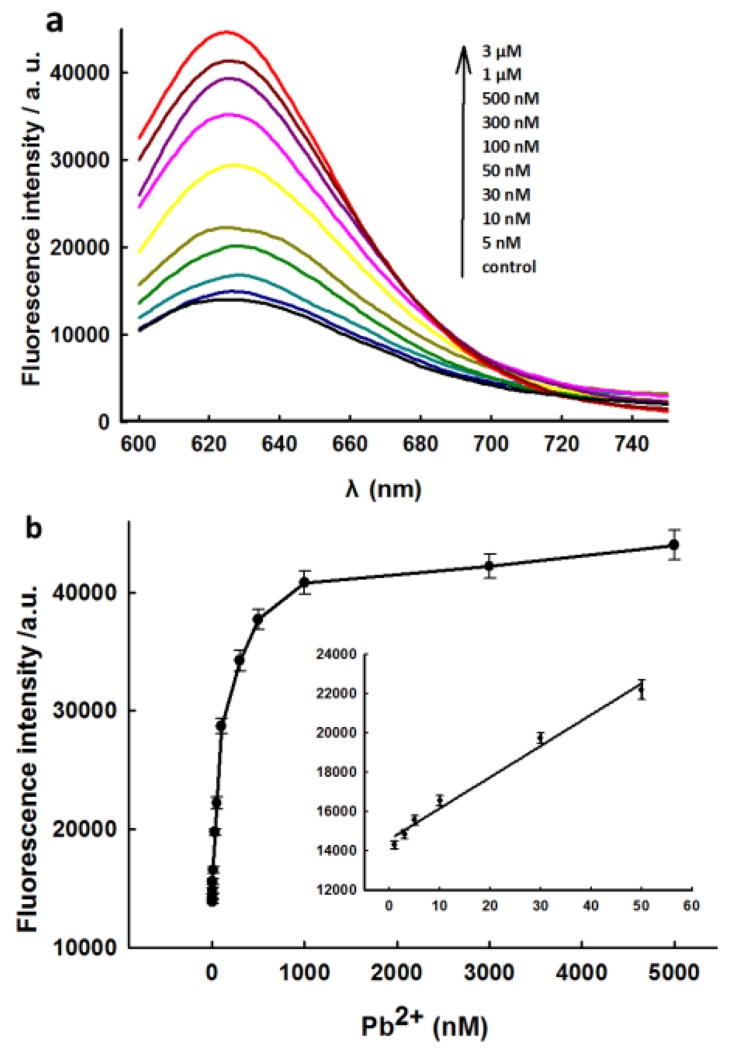
Fig.1.
(a) Fluorescence spectra of sensing system at various concentrations of Pb2+ corresponding to data in the graph. (b) The relationship of the fluorescence enhancement with the Pb2+ concentration. Inset shows the responses of sensing system to Pb2+ at low concentration. The error bars indicated the standard deviations of three independent experiments.

