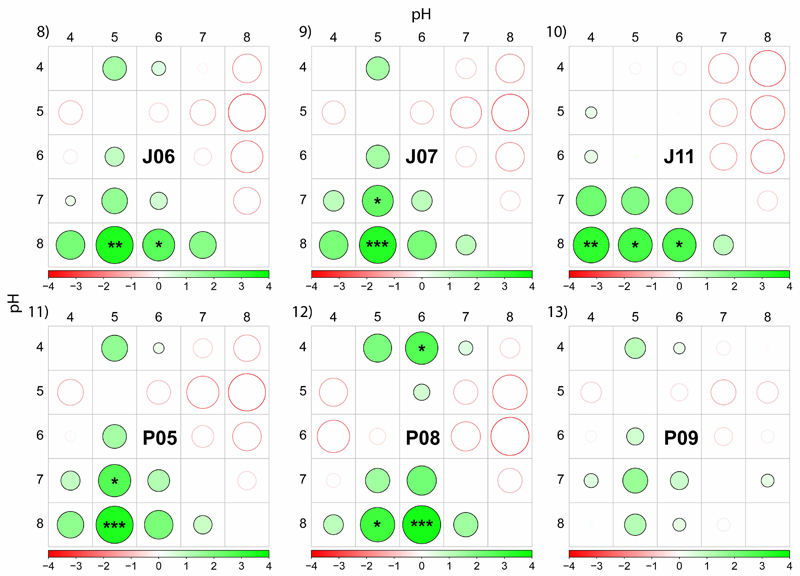
Fig 8–13.
Differences in the effective quantum yield (ΔF/Fm′) of PS II measured at five different pH levels (4–8) on six selected strains (see Figs 2–7 for measured data). Differences were evaluated by post hoc comparisons of nonparametric Friedman two-way ANOVA tests. First, repeated ΔF/Fm′ measurements at different pH values were ordered from highest to lowest. Then, mean ranks were calculated for every pH level. Within each row (a particular pH level), positive and negative differences in ΔF/Fm′ mean ranks are displayed by a symbol size and shading. Filled and empty circles display positive and negative differences in mean ranks, respectively, varying from −4 to 4 (see the colour shade legend). For example, in the strain J06 mean rank in ΔF/Fm′ at pH 4 was higher relative to pH 5 and 6 but lower relative to pH 8. Significant differences as determined by Friedman two-way ANOVA tests are indicated by asterisks (***P < 0.001, **P < 0.01, *P < 0.05).

