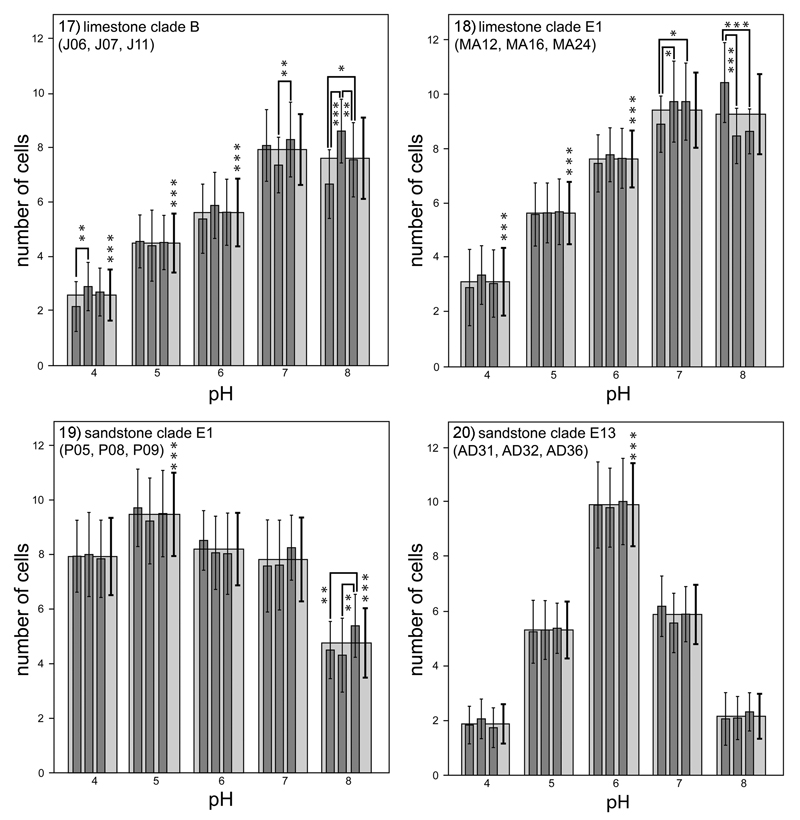
Fig 17–20.
Growth response of four lineages of Klebsormidium (limestone clades B and E1; sandstone clades E1 and E13) to different pH levels (4–8). The graphs display the total number of cells in young filaments grown from single cells after 4 days of cultivation on agar plates. Each lineage is represented by three investigated strains. Dark grey bars display mean number of cells determined for each studied strain, light grey bars display the overall means for the lineage. The mean values were calculated from 30–40 replicates, and the standard deviations are displayed for each measurement. Significant differences as determined by one-way ANOVAs Tukey’s pairwise comparisons are indicated by asterisks (***P < 0.001, **P < 0.01, *P < 0.05).

