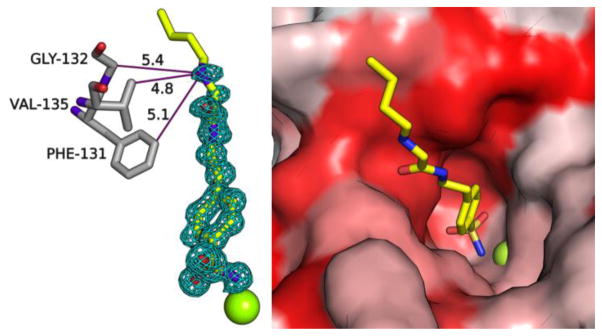
Figure 1.
X-ray crystal structure of TFG 3 bound to CAII. (Left) Simulated annealing omit map (contoured at 3σ) shows 3 bound to Zn2+ (green sphere) in the active site of CAII. Interatomic distances (solid purple lines) are labeled in Å. Water molecules are omitted for clarity. (Right) CAII active-site channel is represented as a surface model (hydrophobes in red; hydrophilic residues in white).

