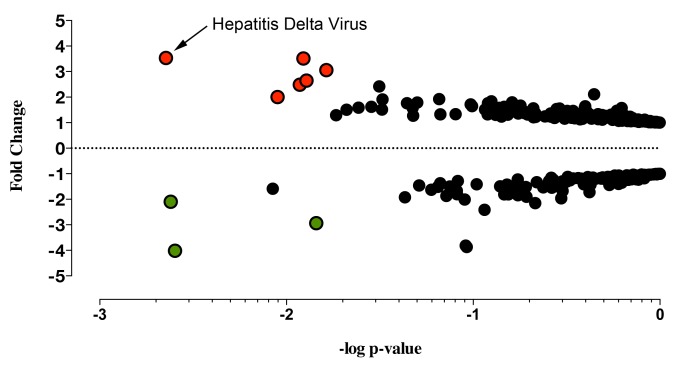
Figure 1.
Collective analysis identified hepatitis delta virus in primary Sjögren's syndrome salivary gland tissue. Collective analysis comparing viral profiles of the pSS patient population to the healthy controls' viral profile identified 9 probes differentially expressed between the pSS population and the healthy controls. The graph denotes fold change and P-values (t-test) for probes above the background threshold. Red (positive fold change) and green (negative fold change) circles denote probes rendering a P-value of < 0.05 after Benjamini-Hochberg correction (P(Corr)< 0.05, t-test, Benjamini-Hochberg correction, n = 29). Black circles denote the remaining probes without a significant change between pSS patients and healthy controls after Benjamini-Hochberg correction (Supplemental Table 2).

