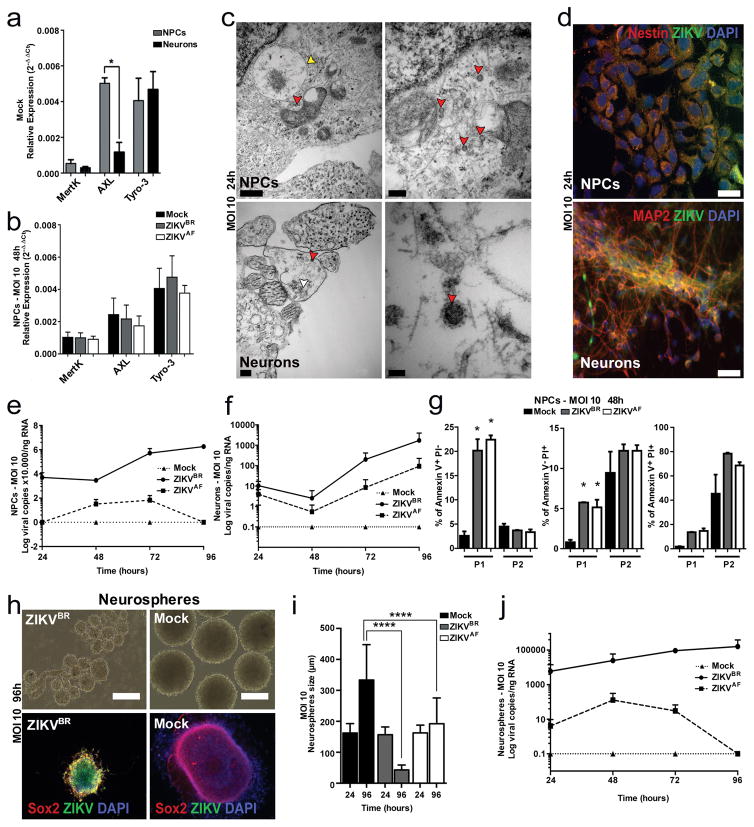
Figure 2. ZIKV infection in vitro.
a, Relative expression of TAM receptors (n = 2 technical replicates from two pooled different donors, error bars, s.e.m; t-test; ***P < 0,01). b, Expression of TAM receptors in NPCs after ZIKVBR infection (MOI = 10) at 48 hours p.i. (n = 2 technical replicates from two pooled different donors, error bars, s.e.m). c, TEM detection of ZIKVBR viral particles 24 hours p.i. at MOI = 10 (red arrowheads) inside NPCs (top panels) and neurons (bottom panels). Viral factories (yellow arrowhead). Immature viral particles (white arrowheads). Scale bars = 0.5 μm/40.000× (top left); 200nm/80.000× (top right); 0.2 μm/50.000× (bottom left); 50 nm/3000.000× (bottom right). d, Immunofluorescence revealed susceptibility to infection in NPC and neurons with the ZIKVBR (MOI = 10) at 24 hours p.i. Scale bar = 25 μm. e, ZIKVBR replication dynamics in NPCs (MOI = 10) (n = 2 technical replicates from RNA of two different donors). f, ZIKVBR replication dynamics in neurons (MOI = 10) (n = 2 technical replicates from RNA of two different donors). g, NPC death measured by FAC with two different cell gating sizes (P1 and P2). Apoptosis (left panel), necrosis (middle panel) and late apoptosis (right panel) (MOI = 10), 48 hours p.i. (n = 2 technical replicates from two different donors; error bars, s.e.m; two-way ANOVA, *P < 0.5). h, Representative images of human neurospheres infected with ZIKVBR (MOI = 10; 96 hours p.i.). Scale bar = 200 μm. i, Alterations in neurosphere diameter over time (MOI = 10) (n = 25 neurospheres from two different donors for each time point; unpaired t-test, ****P < 0.0001). j, ZIKV replication dynamics in neurospheres (MOI = 10) (n = 2 technical replicates from two different donors).

