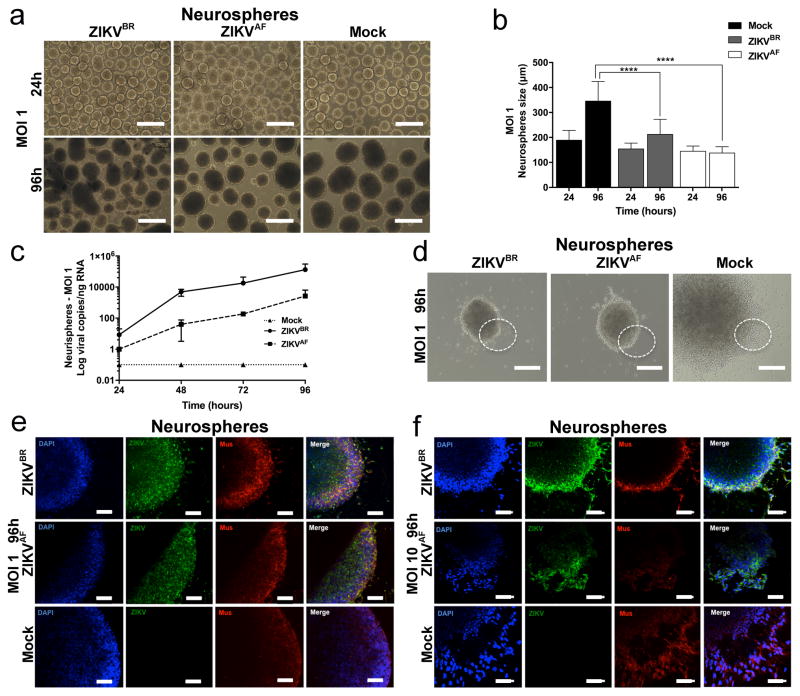
Extended Data Figure 4. Impact of ZIKV infection in human neurospheres.
a, Representative bright-field images of ZIKV infection (MOI = 1) at 24 and 96 hours p.i. Scale bar = 400 μm. b, Alterations in neurospheres diameter over time (MOI = 1) (n = 22 neurospheres from two different donors for each time-point in each condition; unpaired t-test, ****P < 0.0001). c, ZIKV replication dynamics in neurospheres (MOI = 1) (n = 3 technical replicates from two different donors). d, Representative bright-field images of ZIKV infection (MOI = 1) at 96 hours p.i. Scale bar = 400 μm and 1000 μm (Mock). The dotted circle describes the neurospheres borders indicating the immunostained regions in e and f. e, Immunostaining of neurospheres infected with ZIKV at 96 hours p.i. at MOI = 1 (left panel) or MOI = 10 (right panel), revealing a qualitative reduction of proliferative cell migration from Mushashi (Mus)-positive cells. Scale bar = 50 μm.

