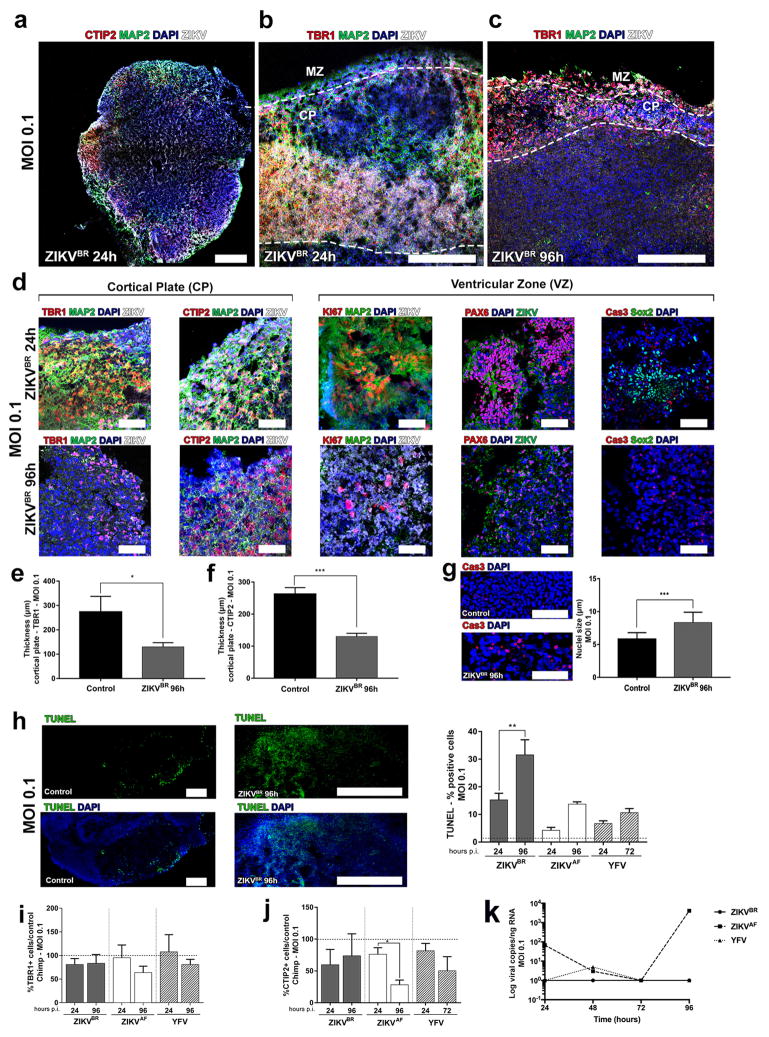
Extended Data Figure 5. Human and chimp cerebral organoids infected with ZIKV.
a, Representative image of an entire cross-section of a cerebral human organoid infected with the ZIKVBR (MOI = 0.1, 24 hours p.i.). Scale bar = 200 μm. b, Detail of the surface of a human organoid infected with the ZIKVBR at 24 hours p.i. (MOI = 0.1). Marginal zone (MZ) and cortical plate (CP) delineated by doted white lines. Scale bar = 200 μm. c, Detail of the surface of a human organoid infected with the ZIKVBR at 96 hours p.i. (MOI = 0.1). Notice the significant tissue damage and reduction in the CP related to 24 hours p.i. Scale bar = 200 μm. d, A representative characterization of CP and ventricular zone (VZ) in human organoid infected with the ZIKVBR at 24 and 96 hours p.i. (MOI = 0.1). Scale bar = 50 μm. e, Reduction in the cortical thickness measured by the extension of TBR1-positive layer of cells in human organoids at 96 hours p.i. (MOI = 0.1). (n = 3 replicates from three human cell lines; error bars, s.e.m; t-test, *P = 0.0203). f, Reduction in the cortical thickness measured by the extension of CTIP2-positive cells layer in human organoids at 96 hours p.i. (MOI = 0.1). (n = 3 replicates from three human cell lines; error bars, s.e.m; t-test, ***P = 0.001). g, Nuclear size (diameter) of cleaved caspase-3 positive apoptotic cells in human organoids at 96 hours p.i. (MOI = 0.1). (n = 10 organoids/slides from three human cell lines; error bars, s.e.m; t-test, ***P = 0.0004). Scale bar = 50 μm. h, Percentage of TUNEL-positive cells in relation to controls (doted line) at 24 and 96 hours p.i. (MOI = 0.1). (n = 10 organoids/slides from three human cell lines; error bars, s.e.m; ANOVA, **P = 0.0042). i, Percentage of TBR1-positive cells in non-primate organoids (Chimp) in relation to controls (doted line) at 24 and 96 hours p.i. (MOI = 0.1) (n = 3 organoids from two donors, error bars, s.e.m; ANOVA). j, Percentage of CTIP2-positive cells in non-primate organoids (Chimp) in relation to controls (doted line) at 24 and 96 hours p.i. (MOI = 0.1) (n = 3 organoids from two donors; error bars, s.e.m; ANOVA). k, Viral replication dynamics in chimpanzee organoids over time (MOI = 0.1) (n = 3 replicates from two donors; error bars, s.e.m; ANOVA).

