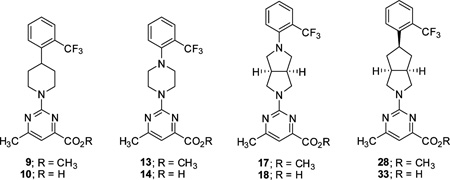
Table 1.
RBP4 SPA Binding Affinity, RBP4 HTRF, and Liver Microsomal Stability Data for 6-Methylpyrimidine-4-carboxylic Acid and Methyl Ester Analogues
 | ||||
|---|---|---|---|---|
| microsomal stability (% remaining) |
||||
| compd | RBP4 SPAa IC50 (nM)c | RBP4 HTRFb IC50 (nM)c | HLMd | RLMe |
| 3 | 15.0 ± 0.005 | 122 ± 0.035 | 3 | 85 |
| 4 | 72.7 | 294 | 100 | 75 |
| 9 | 4.1 | 132 | ND | ND |
| 10 | 35.3 | 188 | 68 | 96 |
| 13 | 9.7 | 1402 | 0.0 | 0.0 |
| 14 | 89.5 | 511 | 18 | 63 |
| 17 | 3.9 | 74.0 | ND | ND |
| 18 | 57.4 | 140 | 80 | 76 |
| 28 | 6.3 | 100 | 0.2 | 9.8 |
| 33 | 12.8 ± 0.4 | 43.6 ± 10.5 | 94 | 93 |
IC50 values for the SPA assay obtained in the presence of a fixed, 10 nM concentration of 3H-retinol.
IC50 values for the HTRF assay obtained in the presence of 1 µM concentration of retinol.
For compounds tested multiple times (more than twice), the IC50 data are represented as the mean ± standard deviation. For those compounds that were only tested twice, the IC50 data are shown as the mean of two independent experiments and not as the mean ± standard deviation.
HLM = human liver microsomes.
RLM = rat liver microsomes. Compound concentration was 10 µM, and incubation time with either human or rat microsomes was 30 min. ND = not determined.
