
Table 3.
RBP4 SPA Binding Affinity and RBP4 HTRF for Pyridine and Other Heteroaromatic Carboxylic Acid Analogues
 | |||
|---|---|---|---|
| Compound | R | RBP4 SPAa IC50 (nM)c |
RBP4 HTRFb IC50 (nM)c |
| 33 | 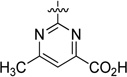 |
12.8 ± 0.4 | 43.6 ± 10.5 |
| 48 | 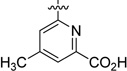 |
14.1 | 295 |
| 49 |  |
53.3 | 228 |
| 50 |  |
584 | 4908 |
| 51 |  |
>3000 | ND |
| 52 |  |
83.2 | 3956 |
| 53 | 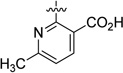 |
68.4 | 2005 |
| 54 |  |
43.8 | 381 |
| 55 |  |
166 | ND |
| 56 |  |
23.0 | 437 |
| 57 | 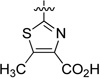 |
29.3 | 495 |
a
IC50 values for the SPA assay obtained in the presence of a fixed, 10 nM concentration of 3H-retinol.
b
IC50 values for the HTRF assay obtained in the presence of 1 µM concentration of retinol.
c
For compounds tested multiple times (more than twice), the IC50 data are represented as the mean ± standard deviation. For those compounds that were only tested twice, the IC50 data are shown as the mean of two independent experiments and not as the mean ± standard deviation. ND = not determined.