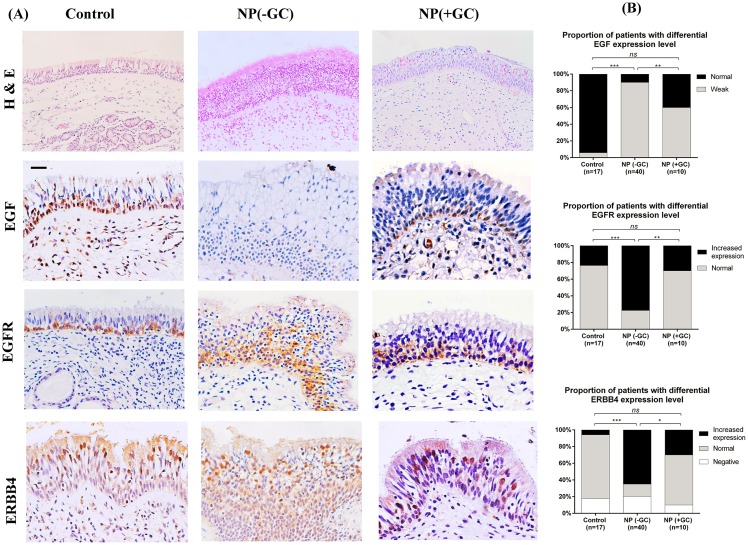
Fig 1. H&E staining (original magnification ×200) of the nasal mucosa from controls, GC-naïve NPs, and GC-treated NPs; expression and localization of EGF, EGFR, and ERBB4 in epithelium from each group (Panel A).
Original magnification ×400 (Scale bar = 20 μm). Comparisons of the expression levels of these three markers were performed by chi-square or Fisher exact test (Panel B). *, p <0.05; **, p <0.01; ***, p <0.001; ns, no significance.

