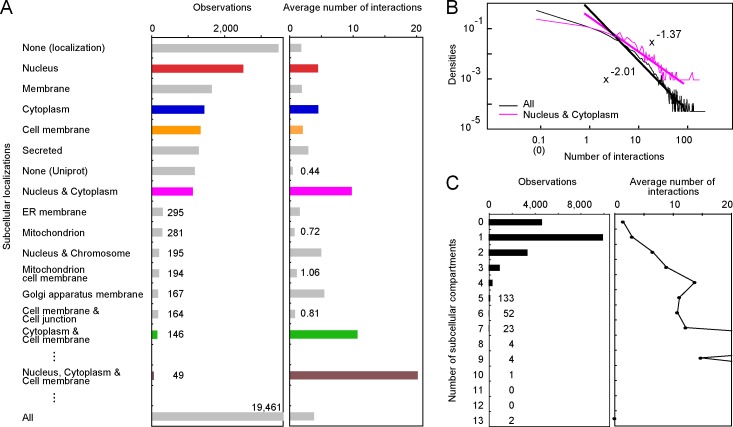
Fig 1. The statistics of the subcellular localizations and the numbers of interactions.
A. The number of proteins (observations) in each subcellular localization and the average number of interactions are indicated, in the descending order of the observations. The data for NP, CP, MP, NCP, CMP, and NCMP are colored red, blue, orange, magenta, green and brown, respectively. None (locatization) means that no subcellular localization was denoted in Uniprot, and None (Uniprot) means that no Uniprot entry was assigned to the HPRD entry. The observations represented by the short bars are shown as numbers, and the number by the bottom bar is the total number of HPRD entries. B. The distribution of the number of interactions in the log-log plot. When the number of interactions was zero, the data are shown at 0.1 interactions. The distribution was approximated by the power function, using the data from 1 to 100 interactions. The scaling exponents are -2.01 and -1.37 for the distributions of all proteins and the NCP, respectively. C. The statistics of the numbers of subcellular compartments for each HPRD entry, and the average number of interactions against the numbers of subcellular compartments. The full size view of the right panel is shown in S1 Fig.

