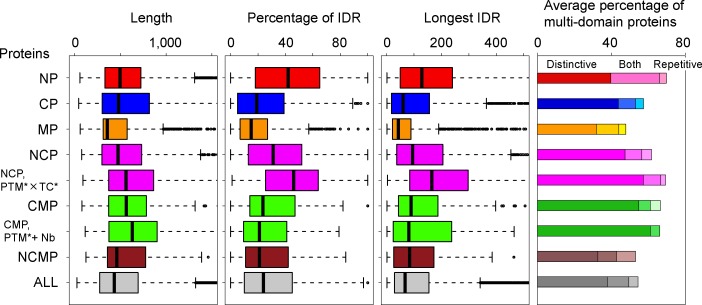
Fig 4. The protein structures characterized according to the intrinsic disorder and the domain architecture.
From the left, the distributions of protein length, percentage of IDR, and longest IDR length are shown (see full size view in S3 Fig). The average percentage of multi-domain proteins is presented in the right panel, where the proteins were divided into those composed of only distinctive multi-domains (D), distinctive and repetitive multi-domains (B), and only repetitive multi-domains (R). The compositions are represented by the brightness of the colors. TC* and Nb are the abbreviations of transcription* and nucleotide-binding.

