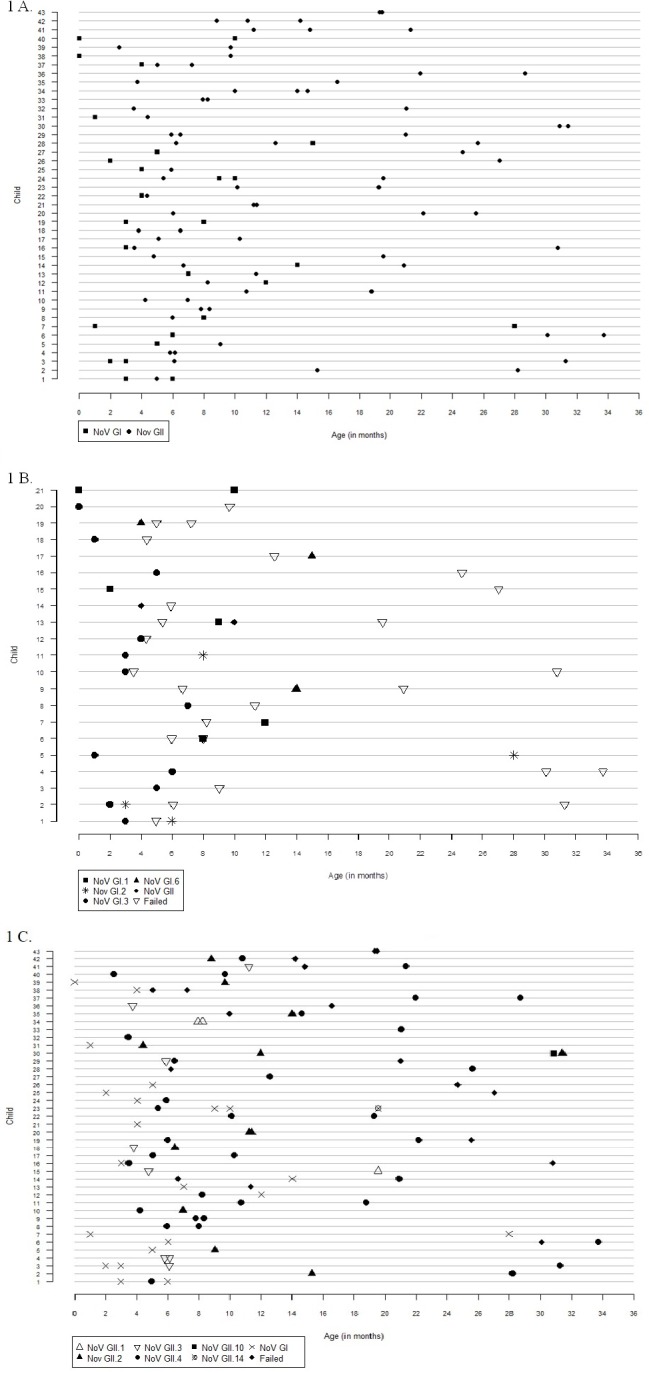
Fig 1. Norovirus genotypes in primary and subsequent diarrheal episodes in children who had more than one infection.

Each line represents one child with re-infection, while the age in months is on the x- axis. Norovirus genotypes are represented by symbols. Samples that failed sequencing have been denoted as Failed in the figure. A) Children with re-infections with either norovirus GI and GII. B) All norovirus GI infection children who were re-infected with either GI or GII noroviruses. GI genotypes are shown, while GII infections are shown only as genogroup. C) All norovirus GII infection children who were re-infected with either GI or GII noroviruses. GII genotypes are shown while GI infections are shown only as genogroup.
