
Fig 2. Seasonal fluctuations in the monthly occurrence of episodes of norovirus-associated diarrhea.
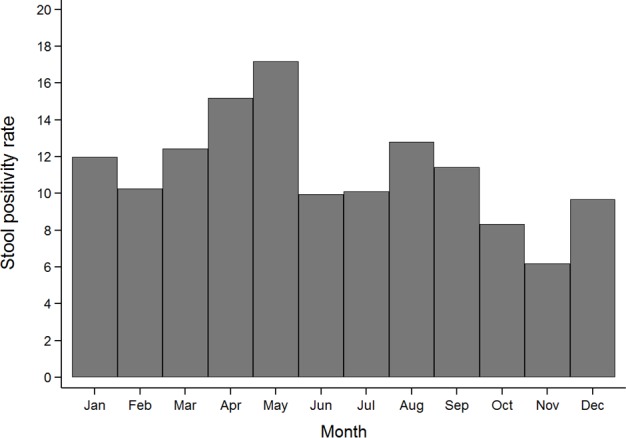
The y-axis represents the monthly stool positivity rates (proportion of diarrheal episodes attributed to norovirus divided by the total number of diarrheal episodes). The x-axis represents the month of the year.