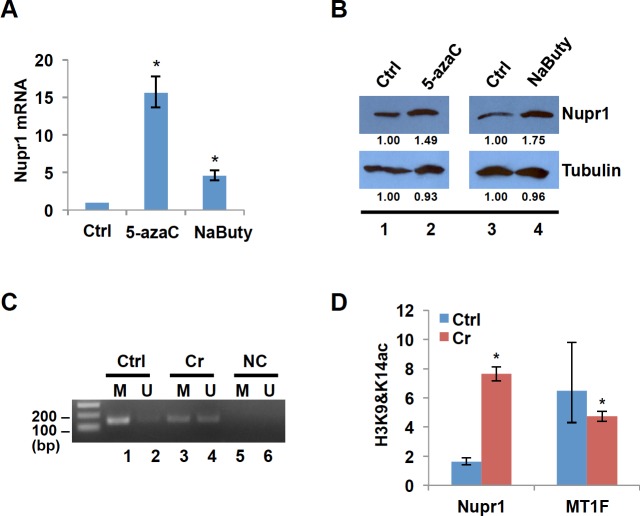
Fig 2. Nupr1 is induced by Cr(VI) through changes in promoter of DNA methylation and histone acetylation.
(A) BEAS2B cells were treated with or without 10 μM 5-aza-2′-deoxycytidine (5-azaC) for 48 h or 5 mM sodium butyrate for 24 h. Total RNA was extracted, and Nupr1 expression was measured by RT-qPCR. The relative gene expression level was normalized to gamma-tubulin expression and is presented as fold change compared to the control group. The data shown are the mean ± S.D. from qPCRs performed in triplicate. *, p<0.01. (B) Total cell lysates were prepared from BEAS2B cells treated with or without 5-azaC or sodium butyrate and subjected to Western blot analysis using antibodies against Nupr1 or Tubulin. The band intensities were quantified using ImageJ software. (C) MSP analysis of Nupr1 promoter. The DNA prepared from BEAS2B cells treated with or without Cr(VI) was treated with bisulfite to convert cytosine to uracil but leave 5-methylcytosine unaffected. Primers utilized for PCR amplification were designated as methylated (M) or unmethylated (U). Amplification products were separated on 2% agarose gel and visualized by ethidium bromide staining. NC: negative control—H2O was used as PCR template. (D) Histone H3K9&14ac in the promoter region of Nupr1. ChIP was carried out with antibodies to H3K9&14ac. Enrichment is shown relative to the genomic abundance measured in the starting chromatin preparation (Input). Unrelated MT1 gene locus was used as a negative control. The data shown are the mean ± S.D. from qPCRs performed in triplicate. *, p<0.01.

