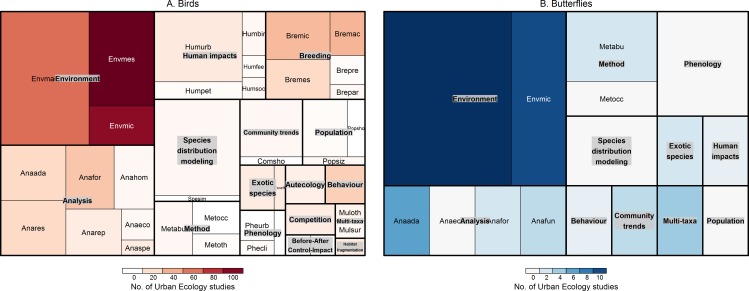
Fig 3.
Hierarchical tree map contrasting the relative popularity of research theme categories addressed with CS datasets to that of the wider UE literature for birds (a) and butterflies (b): the size of the boxes represents the relative popularity of each category amongst CS datasets, while the shading represents the relative popularity of each category out of the overall UE dataset.

