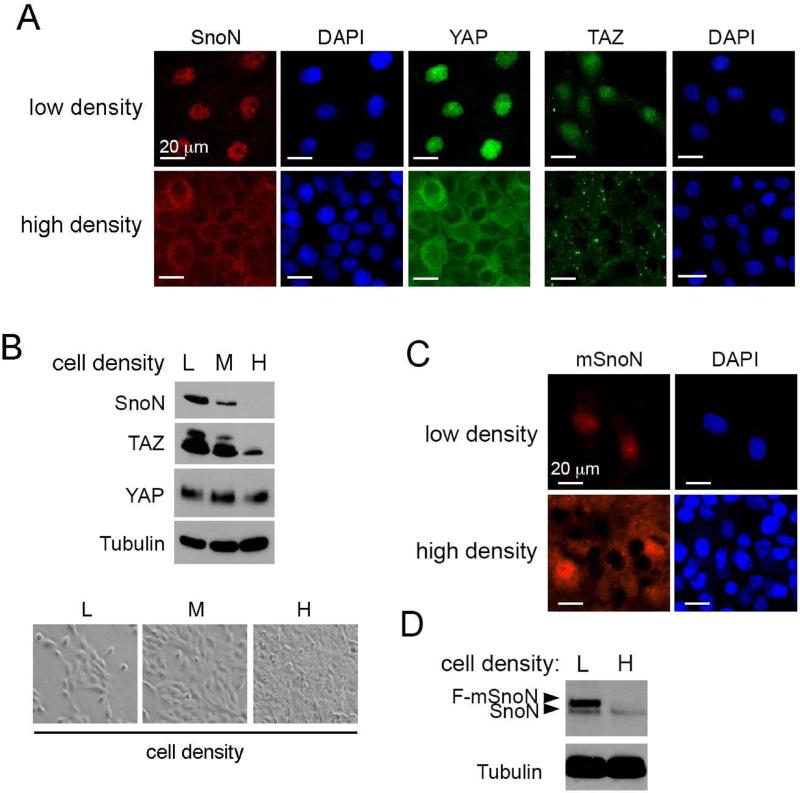
Figure 1. SnoN localization and expression are sensitive to cell density.
(A) Immunofluorescence staining of SnoN (red) and YAP or TAZ (green) in MCF10A cells at low or high cell density. Nuclei were stained with DAPI. Bar, 20 μm. (B) Western blotting analysis of the levels of SnoN, TAZ and YAP (top) in MCF10A cells cultured at low (L), medium (M) or high (H) cell density (bottom). Tubulin was used as a loading control. (C&D) Flag-mSnoN was stably expressed in MCF10A cells, and its localization examined by immunofluorescence staining with anti-Flag (C) and levels detected by Western blotting with anti-SnoN (D).
See also Figure S1.

