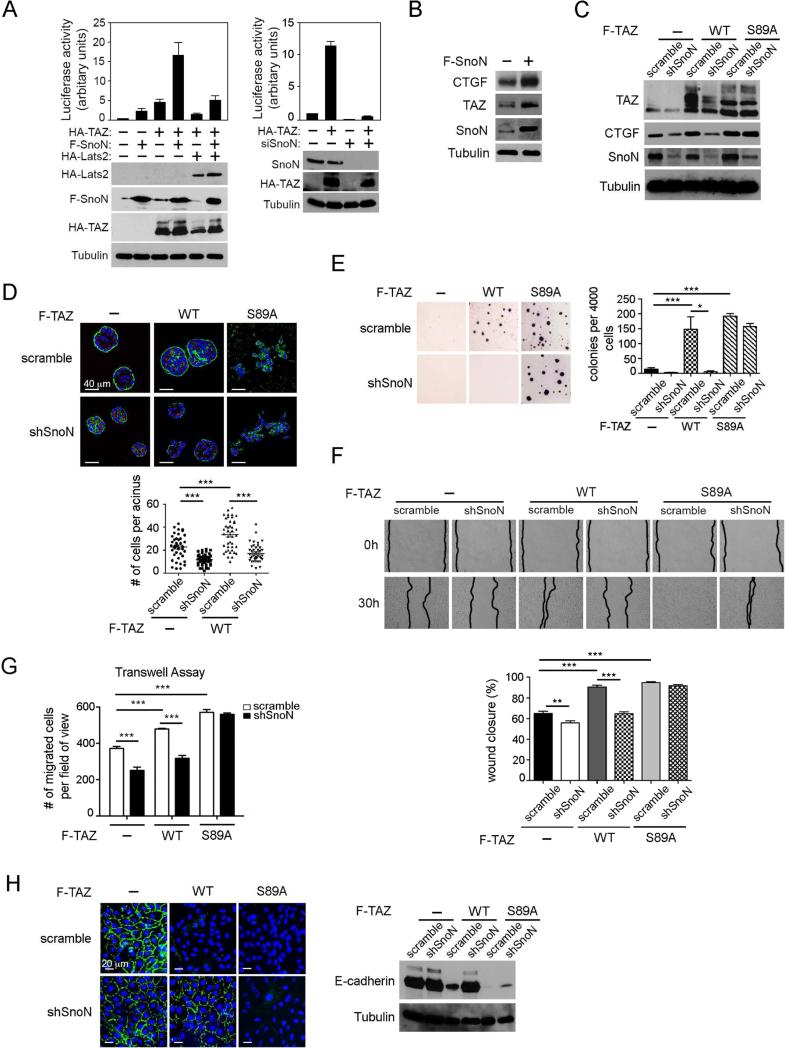
Figure 4. SnoN enhances the transcription and transforming activities of TAZ.
(A) The TAZ-dependent luciferase activity was measured in 293 cells expressing F-SnoN or HA-TAZ either alone or together in the presence or absence of HA-Lats2, or siSnoN in the presence or absence of HA-TAZ. Each data point represents mean ±SEM from two independent wells. (B) Expression levels of CTGF, TAZ and SnoN in MCF10A cells stably expressing F-SnoN or control vector were examined by Western blotting. Tubulin was used as a loading control. (C) Western blotting analysis of TAZ abundance in MCF10A cells expressing WT or S89A TAZ together with or without shSnoN. (D) MCF10A cells stably expressing WT TAZ or TAZS89A together with or without shSnoN were cultured in 3D IrECM for six days before staining for α-integrin (green) as a basolateral marker and GM130 (red) as an apical marker. Nuclei are stained with DAPI (blue). Top: Confocal images are representative of three independent experiments. Scale bar, 40 μm. Bottom: The average size of acini was determined by the number of nuclei in each acinus. Forty acini from three independent experiments were quantified for each cell line and presented in the graph. (E-H). MCF10A cells stably expressing WT TAZ or TAZS89A together with or without shSnoN were subjected to: (E) Soft agar assay; colonies were stained with MTT, quantified and shown in the graph to the right; (F) Wound healing assay: wound closure was monitored at 0 h and 30 h and quantified in the graph (bottom); (G) Cell migration assay: A Transwell assay was performed for 8 h, and the migrated cells were stained and counted. (H) E-cadherin localization was determined by immunofluorescence staining (green, left), and expression level by Western blotting (right). Bar, 20 μm. Data in the graphs in D-G were derived from at least three independent experiments and are presented as means ± SEM [analysis of variance (ANOVA), Newman-Keuls multiple comparison test; *P < 0.05, ** P < 0.01, ***P < 0.001].
See also Figure S2C and Figure S3.

