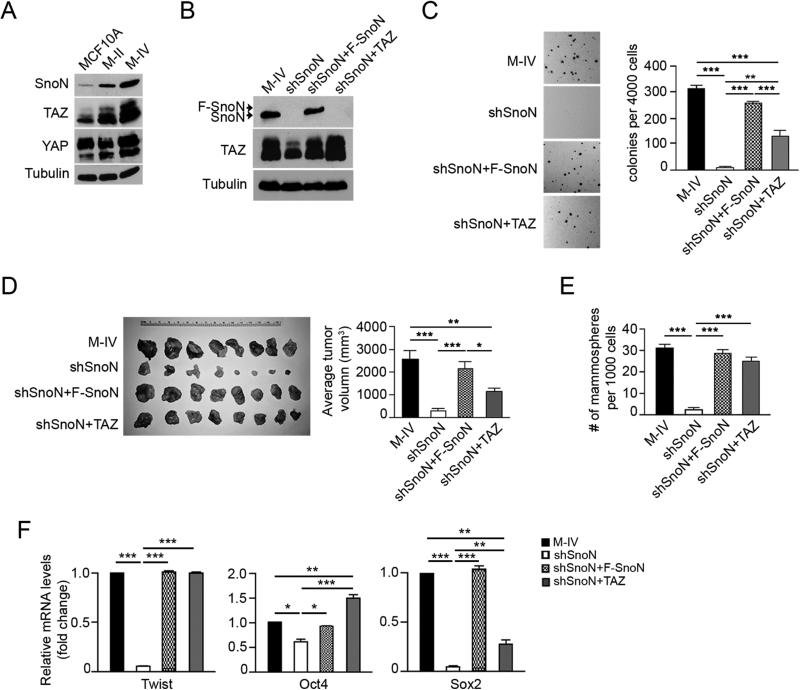
Figure 6. SnoN functions upstream of TAZ in breast cancer cells.
(A) The abundance of SnoN, TAZ and YAP in MCF10A series as shown by Western blotting. (B) Western blotting analysis of endogenous TAZ and SnoN in M-IV cells stably expressing various constructs. (C) Soft agar colonies were stained and quantified in the graph to the right. (D) M-IV cells stably expressing various constructs were injected subcutaneously into the nude mice. Tumors from each mouse were isolated (left), and their sizes measured and quantified (right). (E) Two rounds of mammosphere formation assay were carried out in M-IV cells expressing various constructs. The numbers of mammospheres formed in the second round culture were counted, quantified and shown in the graph. (F) qRT-PCR analysis of breast cancer stem cell markers after normalization to β-actin. Data in C-F were derived from at least three independent experiments and are presented as means ± SEM [analysis of variance (ANOVA), Newman-Keuls multiple comparison test; *P < 0.05, ** P < 0.01, ***P < 0.001].
See also Figure S5 and Figure S6.

