Abstract
Sample pretreatment in conventional cellular metabolomics entails rigorous lysis and extraction steps which increase the duration as well as limit the consistency of these experiments. We report a biomimetic cell culture microfluidic device (MFD) which is coupled with an automated system for rapid, reproducible cell lysis using a combination of electrical and chemical mechanisms. In-channel microelectrodes were created using facile fabrication methods, enabling the application of electric fields up to 1000 V/cm. Using this platform, average lysing times were 7.12 s and 3.03 s for chips with no electric fields and electric fields above 200 V/cm, respectively. Overall, the electroporation MFDs yielded a ∼10-fold improvement in lysing time over standard chemical approaches. Detection of multiple intracellular nucleotides and energy metabolites in MFD lysates was demonstrated using two different MS platforms. This work will allow for the integrated culture, automated lysis, and metabolic analysis of cells in an MFD which doubles as a biomimetic model of the vasculature.
Introduction
Metabolites, the small organic biomolecules which are involved in cellular energetics, signaling, and building blocks for larger macromolecules, are closely representative of cellular function, phenotype, and biochemical environment. Analysis of these small molecules, termed metabolomics, can provide insight into the pathophysiological mechanisms of a variety of diseases. Conventional sample preparation strategies for intracellular metabolomics involve quenching of metabolism and chemical cellular lysis with organic solvents or detergents, followed by sonication and centrifugation steps to precipitate proteins and cellular debris from the metabolic milieu. Such sample pretreatment is time consuming, labor intensive, and prone to variability. MFDs offer several advantages as integrated cell culture and sample preparation platforms for metabolomics, including reduced reagent requirements,1 gas permeability,2 design flexibility, feasibility of flow-based experiments, and on-chip analysis. Furthermore, cell culture, sample preparation, and detection schemes are amenable to automation in many MFDs,3 enabling high throughput, reproducible measurements.
In MFDs, the use of conventional cell lysis techniques such as cell scraping, sonication, and quenching with liquid nitrogen is precluded by the enclosed nature of the channels. Alternatives including thermal,4 optical,5 acoustic,6 mechanical,7, 8 electrical,9, 10 and chemical11-13 methods have been described for on-chip cell membrane permeabilization and metabolite extraction. Improvements in microfabrication have enabled the development of an unlimited assortment of integrated structures and channel geometries for trapping and lysing cells. For instance, an MFD with nanocrystalline diamond microspikes coupled with ultrasonic vibration was found to dramatically increase lysing efficiency of melanoma cells.14 Mechanical on-chip lysis has been accomplished using bead-based and centrifugation methods.15, 16 Other approaches take advantage of the inherent optically transparent nature of many MFDs, e.g., a pulsed laser approach has enabled rapid on-chip analysis of single mouse leukemia cells.17 However, many current techniques for cell lysis in MFDs are relatively slow, require customized equipment, and are not suitable for metabolomics due to the types of reagents or extraction methods employed.
Electroporation is a technique in which pores are created in a cell membrane via the application of a short electrical pulse. When the transmembrane potential exceeds a critical threshold, approximately 0.5 to 1 V in irreversible electroporation,18 dielectric breakdown and lysis occur. Because of the very rapid timescale of this process, electroporation is widely used in both bulk and single cell lysis applications. Electroporation in MFDs has been accomplished by hydrodynamically flowing a cell suspension through an electric field applied across a channel intersection.19 This method has been coupled with electrospray ionization-mass spectrometry (ESI-MS) to analyze proteins in human erythrocytes.20 The Spence group demonstrated electroporation of endothelial cells cultured in a 3D-printed MFD using a low voltage power supply (100-500 V).21 Cells in a specific narrow section of the channel were lysed due to the increased electric field strength in that region, and fluorescence cell viability measurements established the efficiency of the lysing strategy. An automated bulk electroporation technique expanding on this work is desirable for metabolomics applications as it will offer improved lysing speed and extraction of intracellular metabolites; to the best of our knowledge, such a platform has yet to be reported in the literature.
Many current electroporation MFDs utilize expensive metal electrodes, require complicated fabrication, or are limited to lysis of cells in suspension or single cell analysis. We describe here a polydimethylsiloxane (PDMS)/glass hybrid MFD with integrated electrodes and fluidic connections for the culture and electroporation of aortic endothelial cells (ECs). This MFD relies on simple, inexpensive fabrication procedures, including carbon ink micromolded electrodes. The method offers rapid sample preparation consisting of in-line de-salting/rinsing, application of organic solvent, and electroporation. The performance of the automated system was verified with multiple analysis platforms, confirming the utility of the approach for improved culture and sample preparation in vascular metabolomics.
Experimental
Reagents
LC-MS-grade acetone, acetonitrile (ACN), water, and methanol (MeOH) were purchased from Honeywell Burdick & Jackson (Muskegon, MI). Formic acid and all cell culture reagents were obtained from ThermoFisher Scientific (Waltham, MA). Citrate, succinate, α-ketoglutarate, AMP, ADP, and ATP standards were obtained from Sigma Aldrich (St. Louis, MO).
Microfabrication
Culture and lysis MFDs consisted of a three-sided polydimethylsiloxane (PDMS, Ellsworth Adhesives, Germantown, WI) channel layer irreversibly bonded onto a glass slide with 1 mm access holes drilled at each end. Before device assembly, nanoports (Idex Health and Science, Oak Harbor, WA) were affixed over access holes with Loctite adhesive and cured at room temperature for at least an hour. For electroporation experiments, carbon ink microelectrodes were fabricated near each nanoport according to previously published methods.22, 23 Resulting electrodes were 10 μm tall and 40 μm wide (Supplemental Information, Figure S1).
PDMS was mixed 20:1 and cast on a negative master fabricated with SU8-50 photoresist (MicroChem, Westborough, MA) using standard photolithography techniques.24 A serpentine channel design (Figure 1) was chosen in order to maximize cell number on a small device footprint (38 cm2). Channel dimensions were 100 μm high × 800 μm wide × 15 cm long, corresponding to a volume of 12 μL. Chips were cured for 1 h at 75 °C and cut out of the molds. The PDMS channel layer and glass base were treated with oxygen plasma using a plasma cleaner (Harrick Plasma, Ithaca, NY) for 1 minute, aligned, and irreversibly sealed. Copper wires were affixed to each electrode, and colloidal silver polish (Ted Pella, Redding, CA) was applied to facilitate the electrical connection. The assembled devices were sterilized by filling the channels with 70% ethanol in a biosafety cabinet with a UV light source. Channels were then flushed with air and filled with 0.8 mg/mL type 1 collagen (Sigma Aldrich) in 10× PBS. The devices were incubated for at least an hour and then seeded with cells as described below.
Figure 1.
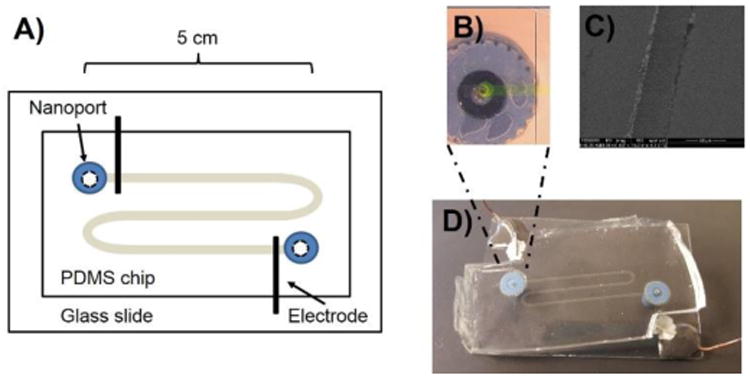
A) Diagram of culture/lysis MFD. B) Micrograph of channel (filled with fluorescein for visualization) sealed over nanoport and microelectrode. C) SEM of electrode at 607× magnification. D) Photograph of completed device.
Cell Culture
Bovine aortic ECs were obtained from Lonza (Walkersville, MD), cultured in 10 cm Petri dishes, and incubated at 37 °C and 4.6% CO2in Dulbecco's Modified Eagle Medium (DMEM) supplemented with 10% fetal bovine serum and 1× gentamicin/amphotericin solution. Cells between passage number 3 and 7 were used for all experiments. Every 2-3 days, cells were rinsed with sterile phosphate-buffered saline (PBS) and media was replaced. When confluent, cells were transferred to microchips. DMEM was removed, and cells were rinsed with PBS and incubated with 500 μL 0.05% trypsin. 10 mL DMEM was added and cells were scraped, removed from the dish, and centrifuged for 5 minutes. The supernatant was removed and the cell pellet was resuspended in 500 μL DMEM, triturated, passed through a 25 gauge needle, and flowed into the microchannel. The process was repeated twice on consecutive days until cells were confluent. Inlet and outlet ports were kept closed with microtight fittings (Idex Health and Science), and microchips were incubated until lysis experiments were performed (within 5 hours of the second cell seeding).
Automated Lysis Platform
Before each lysis experiment, cells cultured in the MFDs were stained with calcein AM, a membrane-permeable dye which is cleaved by intracellular esterases to yield a fluorescent, membrane-impermeable product. Channels were rinsed with PBS to remove media and filled with 5 μM calcein AM (eBioscience, San Diego, CA) in PBS. MFDs were incubated for 15 minutes and transferred to the automated lysing system.
An inverted fluorescence microscope (IX71, Olympus America) equipped with fluorescence filters, a 100 W Hg arc lamp, and a cooled 12-bit monochrome Qicam Fast digital CCD camera (QImaging, Montreal, Canada) was used to visualize all lysing events. Images were captured with Streampix Digital Video Recording software (Norpix, Montreal, Canada), and fluorescence data was acquired with the Streampix gray level averaging plugin using a region of interest of 50 × 150 pixels.
The immobilized cells were lysed using a flow-based approach with a combination of organic solvent (90:10 ACN:H2O) and electroporation. All solutions were flowed through the MFD using syringe pumps (KD Scientific, Holliston, MA) operating at either 20μL/min (DMEM and water) or 50 μL/min (90:10 ACN:H2O). Fluidic connections were made with 150 μm i.d. capillary (Polymicro Technologies, Phoenix, AZ). A 6-position flow selector (VICI, Houston, TX) was used to switch between solutions and a 2-position 6-port valve (VICI) was used to direct outlet flow from the MFD either to waste or to a collection vial. Electroporation was conducted with a high-voltage power supply (HVPS, Spellman, Hauppauge, NY). The flow selector, 6-port injection valve, and HVPS were controlled with an in-house written LabVIEW 2013 program (National Instruments, Austin, TX); a DAQ card (USB 6008, National Instruments) was used to acquire voltage and current readings for each electroporation event as well as control the HVPS with the LabVIEW program.
Cell lysis consisted of 5 steps: 1) Equilibration with DMEM to establish a fluorescence baseline and maintain osmolarity prior to lysis; 2) A 60-second water pulse to remove salt from the system prior to lysate collection; 3) Introduction of 90:10 ACN:H2O; 4) Actuation of a 6-port valve from waste to collect positions; 5) Electroporation via the application of a high electric field. A schematic of the automated lysis platform and a timescale diagram of each step are shown in Figure 2. All lysates were collected for 2 minutes, corresponding to a total volume of 100 μL or 8.3 channel volumes. Lysates were evaporated to dryness in a vacuum centrifuge and stored at -80 °C prior to metabolomic analyses.
Figure 2.
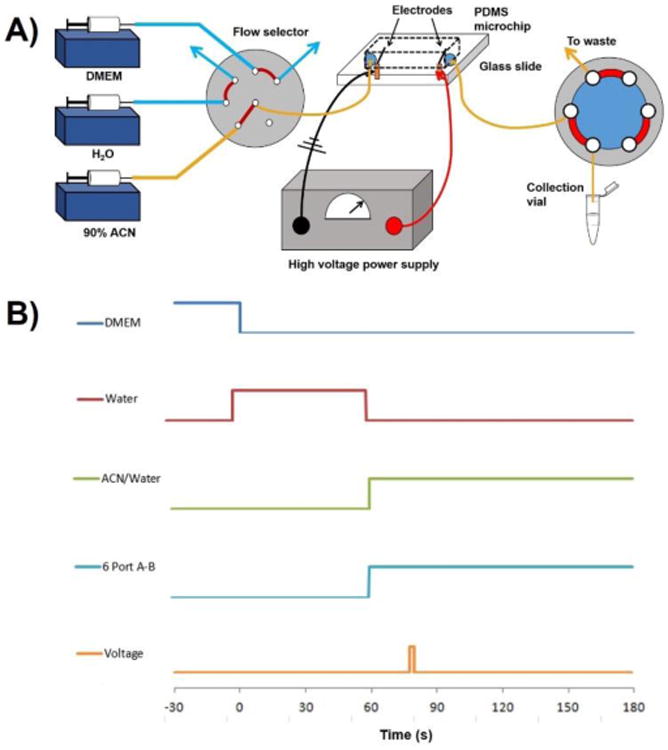
A). Schematic of automated lysing platform with flow selector and 6-port in lysing/collection position. B) Time sequence of steps in the lysing process. Lysate collection begins at t = 60 seconds when the 6-port actuates to position B and ends at t = 180 seconds.
MALDI
Dried lysates were reconstituted in 5 μL 50:50 MeOH:H2O and mixed 1:1 with the matrix 9-aminoacridine (9 mg/mL) as previously described.25 1 μL aliquots of the lysate/matrix mixture were spotted onto a MALDI well plate and dried. Spots were analyzed with a Shimadzu AXIMA Resonance MALDI-QIT-TOF mass spectrometer operating in negative mode with a laser power of 100 and a low mass range ion gate (300-1500 m/z). MS2 experiments were conducted using the same parameters with m/z 506.00 (ATP) or m/z 426.00 (ADP) preselected for CID fragmentation.
LC-MS
Metabolite separation and detection was performed using an Agilent 1260 LC pump with a RPLC Atlantis T3 column (4.6 mm × 150 mm, 3 μm particles) coupled with a TSQ Quantum Access Max triple quadrupole mass spectrometer fitted with an ESI source. Dried lysates were reconstituted in 25 μL aqueous 0.1% formic acid/5% ACN and injected onto the column using a conventional six port injection valve with a 5 μL sample loop. Mobile phases were 0.1% formic acid/5% ACN in water (A) and 100% ACN (B). Separations proceeded over a 30 minute gradient from 0-100% solvent B at 300 μL/min. The mass spectrometer was operated in full MS mode (50-900 Daltons) with an ionization voltage of -3.7 kV.
Data Processing
First derivative plots of fluorescence intensity vs time data were analyzed using PeakFit software (Systat Software, Inc., San Jose, CA). Savitzky-Golay smoothing was performed in AI Expert mode and peaks were automatically placed using the residuals procedure. Shimadzu Biotech Launchpad and Thermo Xcalibur software were used to analyze MALDI and LC-MS data, respectively.
Results and Discussion
On-Chip Cell Culture
Endothelial cells (ECs), which line the interior surfaces of blood vessels, are a widely-used in vitro model of vascular disorders in metabolomics.26-29 Because ECs experience constant shear stress in vivo due to blood flow, microfluidic technologies have been increasingly employed in vascular research in order to more accurately replicate these dynamic culture conditions. MFDs dramatically reduce the reagent requirements for long-term flow-based experiments due to the increased culture area to volume ratio possible on the micro scale. The vascular-mimetic MFD shown in Figure 1 was developed for the integrated culture and lysis of ECs. Channel dimensions (800 μm wide × 100 μm tall) are consistent with the size of a human blood vessel.30 A serpentine design was chosen in order to maximize the total culture area (1.2 cm2) and therefore the signal achievable in metabolomics experiments. While the main emphasis of this work is on the optimization and automation of the lysing process, the device design is amenable to dynamic culture studies; culture has been demonstrated in the MFD for up to 9 days under low-flow conditions (Supplemental Information, Figure S2).
Optimization of Lysing Conditions
Although both current and voltage-driven mechanisms can initiate cell lysis, minimal current is usually desirable in electroporation. High currents can cause Joule heating and water hydrolysis, which could damage or alter cellular contents and lead to bubble formation.31 One of the major advantages of small volume cell culture is the capability of performing bulk electroporation directly in the culture site.; the high resistance of microchannels enables the application of large electric fields while maintaining low current. In conventional cell culture, bulk electroporation is only possible in low volume suspensions and not in culture flasks, which have much higher volumes (several mL) and therefore lower electrical resistance. Most conventional lysing procedures instead rely on chemical methods such as organic solvents. Fluorescence intensity studies performed in culture flasks using standard chemical lysis techniques (a 90:10 ACN/H2O mixture) resulted in lysis times of ∼30-45 s; exact times were difficult to assess due to removal and exchange of solutions. Importantly, such conventional lysing processes are diffusion limited; flow-through lysis MFDs offer the benefit of enhanced convection and continuous delivery of fresh lysing solvent to the cells, which inherently improve lysing time. For the MFD used here, a combination of flow-based electrical and organic lysing methods was chosen in order to maximize electric field by using a less conductive solvent system, and increase lysing speed even further by simultaneously applying the dual lysing modes.
An ACN/H2O mixture was chosen as the solvent system for lysing and metabolite extraction because ACN is compatible with PDMS for short-term experiments,32 is a conductive liquid, and shows superior metabolite extraction performance over other common solvents such as methanol.33 To determine optimal compositions of ACN and water, a test chip (100 μm tall × 800 μm wide × 5 cm long) was filled with mixtures ranging from 0-100% ACN, 20 μA was applied along the channel, and voltage was measured for each solution. Although 100% ACN gave the highest voltage (10 kV), which is beneficial for rapid cell lysis, some water is in the lysing solution is preferred for extraction of polar metabolites. Compared to pure organic solvents, aqueous-organic mixtures offer the additional advantage of denaturing enzymes to a greater extent, which may assist in preserving intracellular metabolite levels prior to analysis.34 Because a 90:10 ACN:H2O mixture resulted in a 2-fold higher voltage than the 80:20 solution in these tests, the 90:10 composition was used for subsequent experiments. Furthermore, in chips with no electroporation, lysing times were approximately 10 seconds slower using the 80:20 solution as compared with the 90:10 solution (data not shown).
An automated sample preparation strategy was developed with the goals of maintaining cell homeostasis prior to lysis, rinsing and removing salts and debris prior to collection, and reproducibly achieving chemical and electrical lysis and collection. As shown in Figure 2, a flow selector enabled delivery of each solution used in the lysing process onto the MFD through a common inlet. Therefore, the timing of each switching step was critical to optimization of on-chip sample preparation. Following immobilization in the chip, cells were stained with calcein AM to confirm viability and enable visualization of membrane rupture. First, with the 6-port in “waste” position, the channel was washed with DMEM at 20 μL/min to remove any detached cells prior to lysis. Actuation of the flow selector initiated a water rinse at 20 μL/min for 60 seconds, or 1.67 channel volumes. A rapid water rinse step prior to quenching of metabolism has been shown to improve sensitivity in conventional sample preparation.35 Next, the flow selector was switched to deliver the lysing solvent, 90:10 ACN/H2O, to the MFD as the 6-port simultaneously rotated into “collect” position. While the lag time for the lysing solvent to traverse the channel and capillary connections was approximately 20 seconds, switching the 6-port at t = 60 seconds ensured that none of the DMEM was collected but that all intracellular metabolites were recovered. Finally, an electric field was applied from one end of the microchannel to the other at the carbon ink electrodes. These in-channel electrodes are a critical element to the device design because they ensure that the voltage is dropped along the length of the channel and not in any resistive connections as may occur with an externally-applied voltage.
Fluorescence intensity measurements of the stained cells revealed that the cells in the middle of the channel began to rupture at t = 78 s, or 18 s after switching the flow selector from water to organic solvent, using only 90:10 ACN/H2O for lysis. Therefore, the timing of the electroporation step was set at 78 s for a 2 s duration for subsequent experiments. First derivative plots of fluorescence decay curves (intensity change/time change vs. time) were prepared for cells lysed with and without voltage and analyzed with PeakFit software to determine lysing time (Figure 3). These graphs show no change in slope until t ≈ 77 s for both types of lysing, followed by a much steeper slope (-125 s-1) in the chip lysed with voltage than in the chip lysed only with organic solvent (-15 s-1), indicating a greater drop in fluorescence intensity per unit time. The peak width of the chip lysed with voltage was 4.1 s smaller than that of the chip with no voltage. Because intracellular enzyme activity and other metabolic reactions can rapidly change metabolite concentrations, such improvements in lysing speed are deemed beneficial. A video of stained cell lysis in the MFD can be found in the Supplemental Information.
Figure 3.
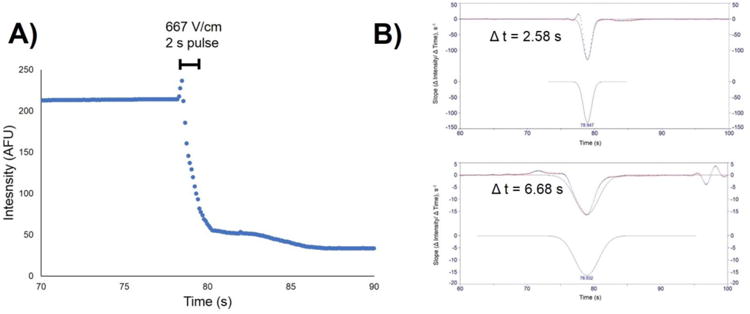
A) Fluorescence decay curve of cell lysis. Electroporation was initiated at t = 78 s with a 667 V/cm pulse for 2 s. B) PeakFit analysis of first derivative fluorescence intensity plots for cells lysed with an electric field of 667 V/cm (top, Δt = 2.58 s), and with no electric field (bottom, Δt = 6.68 s).
Effect of Electric Field on Lysing Time
The magnitude of the electric field applied during lysing proved difficult to control due to differences in conductivity between microchips resulting from inherent variation in cell number and collagen residues on each chip. Because the experiments were timed such that the 90:10 ACN/H2O plug was just beginning to enter the chip when the power supply was turned on, water still remaining in the channel from the water rinse also increased conductivity and attenuated the maximum electric field that could be applied. Therefore, although the power supply was current-limited to 300 μA and always set to deliver 15 kV (1000 V/cm), resistance discrepancies in each chip led to applied electric fields ranging from ∼100-1000 V/cm. Voltage and current readings were recorded for each lysing event in order to determine whether this disparity affected lysing speed. Of n = 19 trials, only 3 of the MFDs produced an electric field < 200 V/cm. A clear division between lysing speed in chips with E > and < 200 V/cm is evident in Figure 4. The average lysing times of cells on chips were found to be 7.12 s for chips with no voltage (n = 3), 7.09 s for chips with E < 200 V/cm (n = 3), and 3.03 s for chips with E > 200 V/cm (n = 16). The chips with higher electric field gave a 57.5% improvement in average lysing speed over those with no voltage. A two-tailed Student's t-test gave a p value of 0.97 for lysing times in chips with no voltage vs low voltage (< 200 V/cm), suggesting no statistical difference between the two lysing modes. P values for lysing times in MFDs were 3.33 × 10-08 and 4.80 × 10-07 for low E vs high E and no E vs high E data sets, respectively; with statistical significance assumed at p ≤0.05, the lysing process is distinctly enhanced by electroporation above this threshold. These data show that beyond a threshold of 200 V/cm for 2 sec and under continuous flow conditions, cells were lysed rapidly and within a reproducible time frame (standard deviation ±0.722 s). Beneath this threshold, the electric field had little effect on cell lysis time. The lysing times reported here are in line with or better than data from other microfluidic electroporation studies, particularly for adherent cells (Supplemental Table S1).
Figure 4.
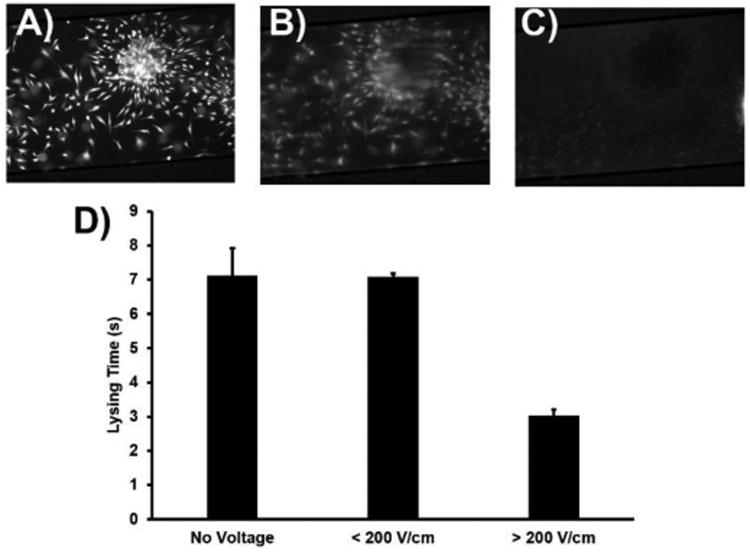
Fluorescence micrographs of cells stained with 5 μM calcein AM A) before, B) 2 seconds after electroporation, and C) 20 seconds after electroporation. D) Effect of electric field strength on lysing time in chips with no voltage (n = 3), low electric field (n = 3), and high electric field (n = 16). Error bars are SEM.
Metabolomics Analyses
Coupling MFDs with conventional analytical instrumentation for cellular metabolomics presents unique challenges resulting from the lower cell culture area (∼8-fold) and reduced flow rates used at the micro scale. Dried cell lysates collected using the automated lysis platform were reconstituted in appropriate solvents (see Experimental) and analyzed by two different mass spectrometric techniques in order to determine 1) whether the number of cells immobilized on the device resulted in appreciable metabolic signals, and 2) whether on-chip sample preparation was sufficient for metabolite detection. The latter was of particular concern since membrane sonication and protein precipitation steps were not performed. Of note, however, was that bright field images indicated that the majority of cellular membranes were retained in the MFD, likely attached to collagen, following lysis (Supplemental Information, Figure S3). These observations suggest that the MFD precludes the need for additional centrifugation or precipitation steps.
Nucleotides are important indicators of cellular redox/energy status and are particularly conducive to negative mode MALDI analysis due to their high electronegativity.36 Here, reconstituted cell lysates were mixed with MALDI matrix 9-aminoacridine and qualitatively analyzed for nucleotide content. The three forms of phosphorylated adenosine (AMP, ADP, ATP), as well as uridine diphosphate-N-acetylglucosamine (UDP-Glc-NAc) were detected in cell lysates (Figure 5). Chemical identities were confirmed by matching exact mass to commercially available standards, and these analytes were not detected in effluent from a test chip with no cells. ATP and ADP were further verified by matching MS2 fragmentation patterns to the metabolomics database METLIN. Nucleotides play many roles as energy carriers, in cellular signaling, and as phosphate donors for post-translational modification of proteins. UDP-Glc-NAc is involved in the insulin signaling cascade and is an end product of the hexosamine pathway, which has been implicated in the pathogenesis of diabetes mellitus.37 Interfacing the MFD lysing platform with MALDI detection presents a new avenue for future research investigating the role of nucleotide metabolism in such vascular disorders.
Figure 5.
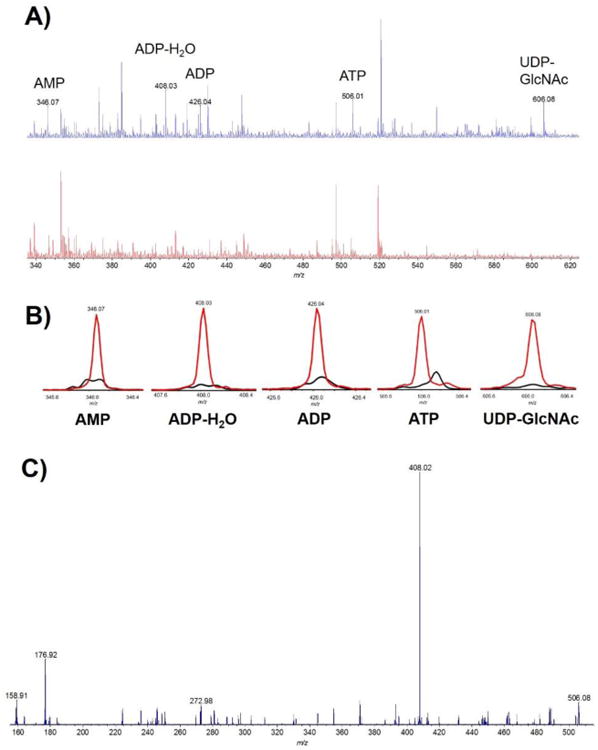
A) MALDI spectrum of nucleotides in cell lysate (top trace), and in a blank chip (bottom trace). B) MALDI spectra overlay of individual compounds in cell lysate (red trace) and in a blank (black trace). C) Fragmentation spectrum of ATP.
TCA cycle compounds participate in metabolic reactions extending beyond their role in cellular respiration, including amino acid synthesis, and are of interest in vascular metabolomics due to the relationship between TCA cycle regulation and oxidative stress.38, 39 RPLC-ESI-MS was employed to detect low molecular weight TCA cycle intermediates in samples collected from the automated MFD lysis system. Citrate, succinate, and α-ketoglutarate were identified in lysates by matching masses and retention times to 50 μM standards separated using the same gradient (Figure 6). None of these compounds were observed in effluent from blank chips containing collagen but no cells. Importantly, appreciable signals were obtained for each of these compounds using a conventional analytical column, indicating acceptable cell density in the serpentine MFDs. In future studies, capillary LC-MS may enable the detection of less abundant or more poorly ionized metabolites in the MFD lysates.
Figure 6.
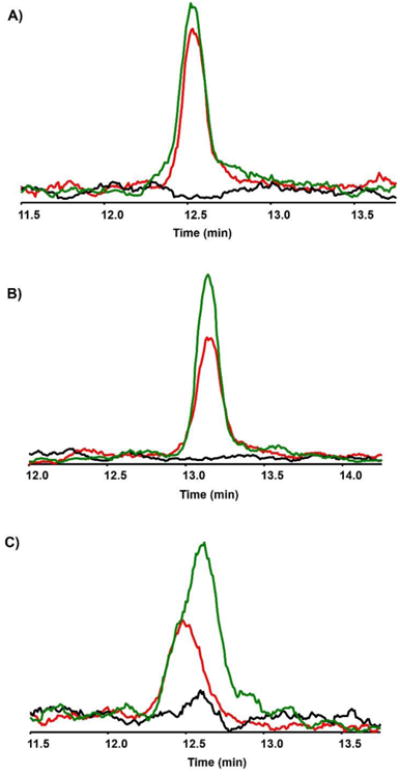
Chromatograms of 50 μM standards (green trace), cell lysate (red trace), and blanks (black trace) for citrate (A), succinate (B), and α-ketoglutarate (C).
Conclusion
Conventional cell culture-based methods for metabolomics have proven inadequate both in their inability to mimic physiological conditions present in vivo and in their laborious sample preparation requirements, which could lead to the loss of biological information prior to analysis. An automated MFD for improving lysis times using a combination of organic solvent and bulk electroporation was developed and fully characterized using fluorescence microscopy. Complete flow-based cell lysis was achieved within 3.03 seconds using in-channel electroporation at electric fields > 200 V/cm, representing a 2.3-fold and ∼10-fold improvement over on-chip lysis using only organic solvent and over conventional diffusion-based chemical lysis, respectively. MALDI and LC-MS analyses of the MFD lysates resulted in the detection of several species relevant to vascular metabolomics. Future work will include interfacing the automated lysing MFD with online analysis platforms, the use of capillary LC-MS columns for enhanced sensitivity, and investigation of cellular metabolic changes in response to pathophysiological stimuli such as hyperglycemia.
Supplementary Material
Figure S1: Long-term MFD cell culture; Figure S2: Bright field image of cells in an MFD post-lysis; Figure S3: SEM of carbon ink microelectrode.
Video: Cell lysis showing release of fluorescent dye.
Acknowledgments
This work is supported by the National Institutes of Health (USA): 1R15GM113153 (JLE).
The authors wish to thank Dr. Dave Wood of the Protein Core Facility in the Saint Louis University Department of Biochemistry for his assistance with MALDI analyses.
Footnotes
Electronic Supplementary Information (ESI) available: See DOI: 10.1039/x0xx00000x
References
- 1.Karlinsey JM, Monahan J, Marchiarullo DJ, Ferrance JP, Landers JP. Analytical Chemistry. 2005;77:3637–3643. doi: 10.1021/ac048115z. [DOI] [PubMed] [Google Scholar]
- 2.McDonald JC, Duffy DC, Anderson JR, Chiu DT, Wu H, Schueller OJ, Whitesides GM. Electrophoresis. 2000;21:27–40. doi: 10.1002/(SICI)1522-2683(20000101)21:1<27::AID-ELPS27>3.0.CO;2-C. [DOI] [PubMed] [Google Scholar]
- 3.Martin RS, Root PD, Spence DM. Analyst. 2006;131:1197–1206. doi: 10.1039/b611041j. [DOI] [PubMed] [Google Scholar]
- 4.Waters LC, Jacobson SC, Kroutchinina N, Khandurina J, Foote RS, Ramsey JM. Anal Chem. 1998;70:158–162. doi: 10.1021/ac970642d. [DOI] [PubMed] [Google Scholar]
- 5.Lin YH, Lee GB. Sensors and Actuators B: Chemical. 2010;145:854–860. doi: 10.1016/j.snb.2010.01.063. [DOI] [PMC free article] [PubMed] [Google Scholar]
- 6.Tandiono T, Ow DS, Driessen L, Chin CS, Klaseboer E, Choo AB, Ohl SW, Ohl CD. Lab Chip. 2012;12:780–786. doi: 10.1039/c2lc20861j. [DOI] [PubMed] [Google Scholar]
- 7.Wang J, Stine MJ, Lu C. Analytical Chemistry. 2007;79:9584–9587. doi: 10.1021/ac701854b. [DOI] [PubMed] [Google Scholar]
- 8.Prinz C, Tegenfeldt JO, Austin RH, Cox EC, Sturm JC. Lab on a Chip. 2002;2:207–212. doi: 10.1039/b208010a. [DOI] [PubMed] [Google Scholar]
- 9.Mernier G, Martinez-Duarte R, Lehal R, Radtke F, Renaud P. Micromachines. 2012;3:574. [Google Scholar]
- 10.Ameri SK, Singh PK, Dokmeci MR, Khademhosseini A, Xu Q, Sonkusale SR. Biosensors and Bioelectronics. 2014;54:462–467. doi: 10.1016/j.bios.2013.11.031. [DOI] [PubMed] [Google Scholar]
- 11.Irimia D, Tompkins RG, Toner M. Anal Chem. 2004;76:6137–6143. doi: 10.1021/ac0497508. [DOI] [PubMed] [Google Scholar]
- 12.Zeringue HC, Wheeler MB, Beebe DJ. Lab on a Chip. 2005;5:108–110. doi: 10.1039/b406703g. [DOI] [PubMed] [Google Scholar]
- 13.Di Carlo D, Ionescu-Zanetti C, Zhang Y, Hung P, Lee LP. Lab on a Chip. 2005;5:171–178. doi: 10.1039/b413139h. [DOI] [PubMed] [Google Scholar]
- 14.Khanna P, Ramachandran N, Yang J, Wang J, Kumar A, Jaroszeski M, Bhansali S. Diamond and Related Materials. 2009;18:606–610. [Google Scholar]
- 15.Geissler M, Beauregard JA, Charlebois I, Isabel S, Normandin F, Voisin B, Boissinot M, Bergeron MG, Veres T. Engineering in Life Sciences. 2011;11:174–181. [Google Scholar]
- 16.Kido H, Micic M, Smith D, Zoval J, Norton J, Madou M. Colloids and surfaces B, Biointerfaces. 2007;58:44–51. doi: 10.1016/j.colsurfb.2007.03.015. [DOI] [PubMed] [Google Scholar]
- 17.Lai HH, Quinto-Su PA, Sims CE, Bachman M, Li GP, Venugopalan V, Allbritton NL. Journal of the Royal Society Interface. 2008;5:S113–S121. doi: 10.1098/rsif.2008.0177.focus. [DOI] [PMC free article] [PubMed] [Google Scholar]
- 18.Saulis G, Saule R. Acta Physica Polonica A. 2009;115:1056–1058. [Google Scholar]
- 19.Hargis D, Alarie JP, Ramsey JM. Electrophoresis. 2011;32:3172–3179. doi: 10.1002/elps.201100229. [DOI] [PMC free article] [PubMed] [Google Scholar]
- 20.Mellors JS, Jorabchi K, Smith LM, Ramsey JM. Analytical Chemistry. 2010;82:967–973. doi: 10.1021/ac902218y. [DOI] [PMC free article] [PubMed] [Google Scholar]
- 21.Gross C, Anderson KB, Meisel JE, McNitt MI, Spence DM. Analytical Chemistry. 2015;87:6335–6341. doi: 10.1021/acs.analchem.5b01202. [DOI] [PMC free article] [PubMed] [Google Scholar]
- 22.Mecker LC, Martin RS. Electrophoresis. 2006;27:5032–5042. doi: 10.1002/elps.200600401. [DOI] [PubMed] [Google Scholar]
- 23.Mecker LC, Filla LA, Martin RS. Electroanalysis. 2010;22:2141–2146. doi: 10.1002/elan.201000118. [DOI] [PMC free article] [PubMed] [Google Scholar]
- 24.Martin RS, Gawron AJ, Lunte SM, Henry CS. Analytical Chemistry. 2000;72:3196–3202. doi: 10.1021/ac000160t. [DOI] [PubMed] [Google Scholar]
- 25.Edwards JL, Kennedy RT. Analytical Chemistry. 2005;77:2201–2209. doi: 10.1021/ac048323r. [DOI] [PubMed] [Google Scholar]
- 26.Esch C, Hui DS, Lee R, Edwards JL. Analytical Methods. 2015;7:7164–7169. [Google Scholar]
- 27.Yuan W, Zhang§ J, Li S, Edwards JL. Journal of Proteome Research. 2011;10:5242–5250. doi: 10.1021/pr200815c. [DOI] [PubMed] [Google Scholar]
- 28.Pennathur S, Heinecke JW. Current Diabetes Reports. 2007;7:257–264. doi: 10.1007/s11892-007-0041-3. [DOI] [PubMed] [Google Scholar]
- 29.Yuan W, Edwards JL. Journal of Chromatography A. 2011;1218:2561–2568. doi: 10.1016/j.chroma.2011.02.063. [DOI] [PubMed] [Google Scholar]
- 30.Kurbel S, Gros M, Marić S. Advances in Physiology Education. 2009;33:130–131. doi: 10.1152/advan.90217.2008. [DOI] [PubMed] [Google Scholar]
- 31.B. Morshed, M. Shams and T. Mussivand, 2013, 41, 37-50
- 32.Lee JN, Park C, Whitesides GM. Analytical Chemistry. 2003;75:6544–6554. doi: 10.1021/ac0346712. [DOI] [PubMed] [Google Scholar]
- 33.Rabinowitz JD, Kimball E. Anal Chem. 2007;79:6167–6173. doi: 10.1021/ac070470c. [DOI] [PubMed] [Google Scholar]
- 34.Griebenow K, Klibanov AM. Journal of the American Chemical Society. 1996;118:11695–11700. [Google Scholar]
- 35.Lorenz MA, Burant CF, Kennedy RT. Analytical Chemistry. 2011;83:3406–3414. doi: 10.1021/ac103313x. [DOI] [PMC free article] [PubMed] [Google Scholar]
- 36.Parker L, Engel-Hall A, Drew K, Steinhardt G, Helseth DL, Jabon D, McMurry T, Angulo DS, Kron SJ. Journal of mass spectrometry : JMS. 2008;43:518–527. doi: 10.1002/jms.1342. [DOI] [PMC free article] [PubMed] [Google Scholar]
- 37.Edwards JL, Vincent A, Cheng T, Feldman EL. Pharmacology & therapeutics. 2008;120:1–34. doi: 10.1016/j.pharmthera.2008.05.005. [DOI] [PMC free article] [PubMed] [Google Scholar]
- 38.Filla LA, Yuan W, Feldman EL, Li S, Edwards JL. Journal of Proteome Research. 2014;13:6121–6134. doi: 10.1021/pr501030e. [DOI] [PMC free article] [PubMed] [Google Scholar]
- 39.Hinder LM, Vivekanandan-Giri A, McLean LL, Pennathur S, Feldman EL. Journal of Endocrinology. 2013;216:1–11. doi: 10.1530/JOE-12-0356. [DOI] [PMC free article] [PubMed] [Google Scholar]
Associated Data
This section collects any data citations, data availability statements, or supplementary materials included in this article.
Supplementary Materials
Figure S1: Long-term MFD cell culture; Figure S2: Bright field image of cells in an MFD post-lysis; Figure S3: SEM of carbon ink microelectrode.
Video: Cell lysis showing release of fluorescent dye.


