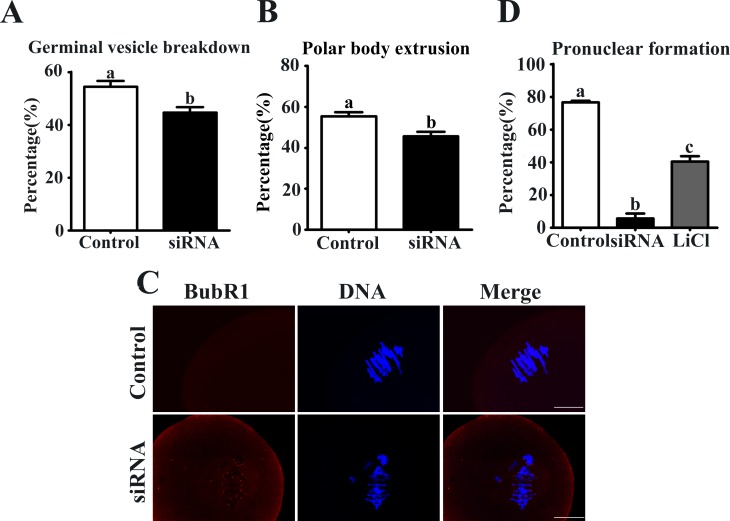
Fig 4. Axin-1 depletion decreased GVBD, PB1 extrusion and activated SAC.
(A) The rate of GVBD in different group. (B) Percentages of first polar body (PB1) extrusion in the Axin1 siRNA microinjection and control group. (C) Detection of BubR1 (red) in oocytes in the control and Axin1 siRNA groups. DNA is stained with DAPI (blue). Scale bar = 20 μm. (D) The rates of pronuclear formation are shown in different groups. Data are presented as the mean ± SEM of three independent experiments. Different superscript letters indicate significant differences at P < 0.05.

