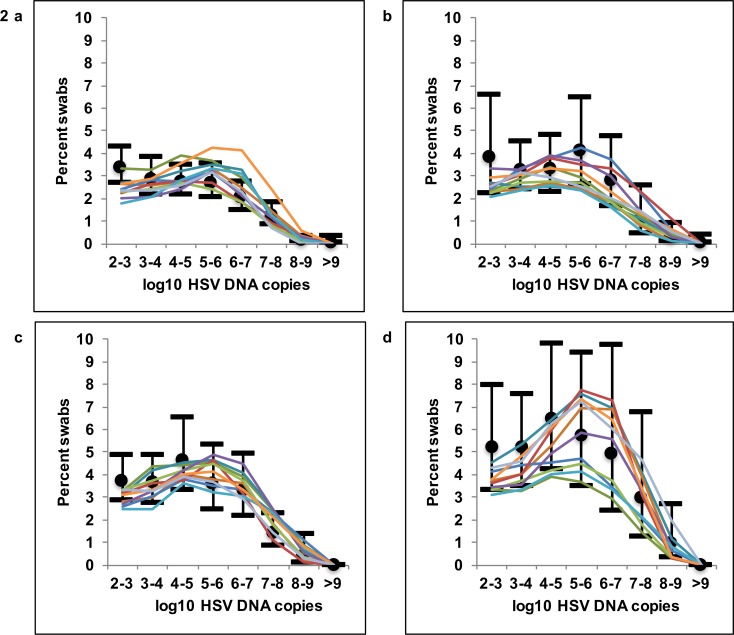
Fig 2. Mathematical model fit to quantitative shedding rate and episode rate.
Ten mathematical model simulations of HSV-2 shedding (thin colored lines) in reference to empirical shedding data (median marked with black dot and 95% CI with black horizontal bars). Quantitative shedding per swab for (A) HIV negative, and HIV positive men with (B) CD4+ T-cells >500/μL, (C) 200-499/μL and (D) <200/μL.

