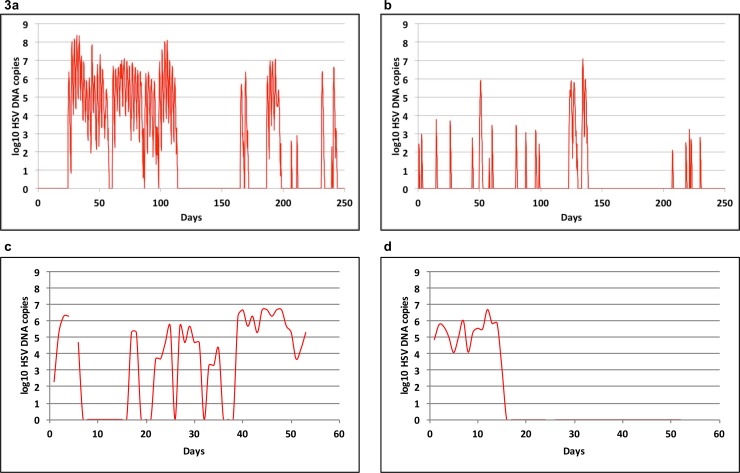
Fig 3. Increased HSV-2 shedding rate, episode rate and episode duration in HIV infected men.
The red line indicates genital HSV-2 viral load over time. Model output for 300 days with parameters optimized for men with (A) HIV infection and CD4+ T-cell count<200/μL and (B) no HIV infection. Data from individual study participants with (C) HIV infection and CD4+ T-cell count<200/μL and (D) no HIV infection. Individuals in (C) and (D) performed daily swabs.

