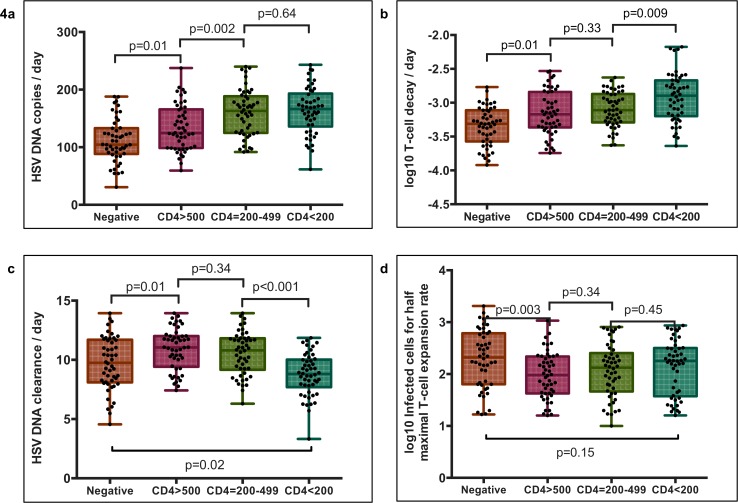
Fig 4. Immunologic determinants of increased HSV-2 shedding in HIV-1 infected men.
Parameter sets represent the top 50 (5%) model fits for each group. Boxplots whiskers are inclusive of the full range of values. The box includes interquartile range and a median line. (A) HSV-2 release rate from ganglia to the genital tract, (B) Genital T-cell decay rate, (C) Genital HSV-2 DNA clearance rate and (D) Number of infected cells needed to stimulate half-maximal genital T-cell expansion. All comparisons are with Mann Whitney rank tests. Of note, genital T-cell levels in the model are intended as a surrogate measure of cytolytic immune potential.

